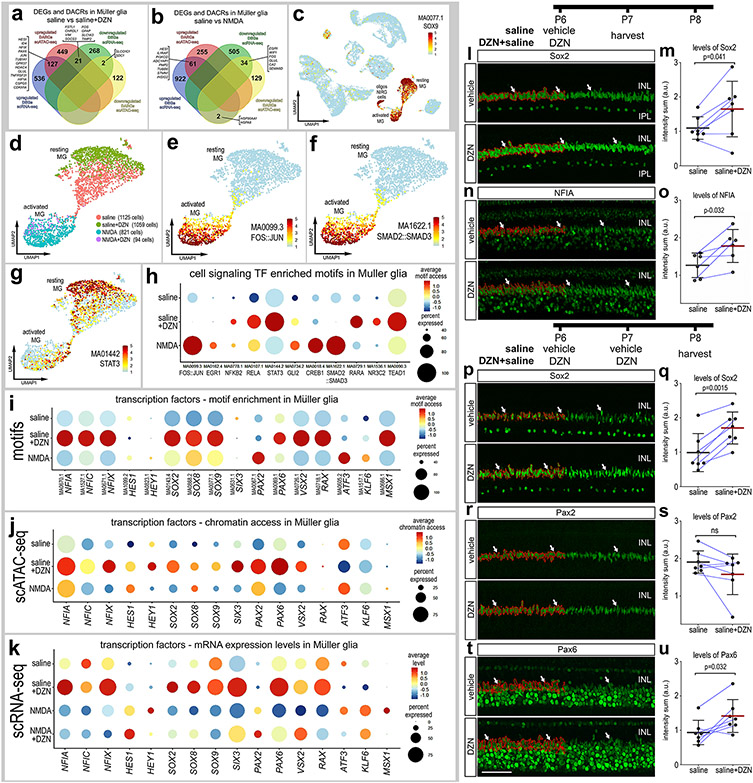
Figure 6. Comparison of differentially expressed genes (DEGs), differentially accessible chromatin regions (DACRs) and access to transcription factor binding motifs in MG.
Venn diagrams illustrate numbers of genes with increased or decreased expression levels or chromatin access in MG from retinas treated with saline vs saline+DZN (a) or saline vs NMDA (b). UMAP heatmap plot in c illustrates access to SOX9 DNA-binding motifs across all types of retinal cells. Motifs enriched in activated and resting MG were identified and included motifs for transcriptional effectors of cell signaling pathways (d-h). UMAP heatmap plots for MG illustrate differential access to motifs for FOS::JUN, SMAD2::SMAD2 and STAT3 in resting and activated MG (e-g). Dot plots illustrate heatmaps for levels of access and percent of cells with access for transcriptional effectors of cell signaling pathways (h) or transcription factors (i). For direct comparison with motif access, dot plots illustrate levels of chromatin access (j) and mRNA (k) for key transcription factors. (l-u) Quantitative immunofluorescence for Sox2, NFIA, Pax2 or Pax2 (green) within the nuclei or MG following one (l-o) or two doses of DZN (p-u). Thresholded areas of MG nuclei used for measurements are outlined in red on only the left half of the images. Histograms represent the mean (bar±SD) and each dot represents one biological replicate (blue lines connect control and treated eyes from the same individual) for levels of immunofluoresence within MG nuclei. Arrows indicate nuclei of MG. The scale bar (50 μm) in panel t applies to panels a,n,p,r and t. Significance of difference (p values) was determined using a paired t-test. Abbreviations: ONL – outer nuclear layer, INL – inner nuclear layer.

