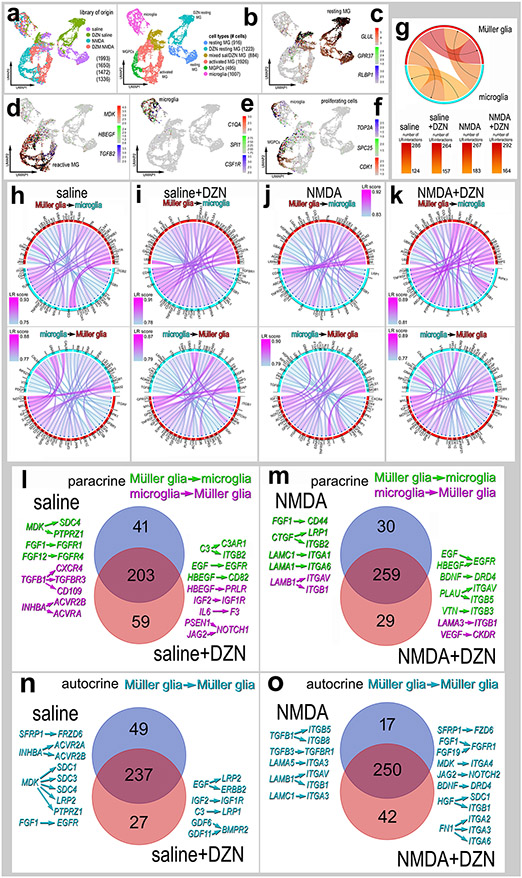
Figure 7. Ligand-receptor (LR) interactions inferred from scRNA-seq data between microglia and MG.
Retinal microglia and MG were isolated, re-embedded and ordered in UMAP plots (a,b). Treatment groups included saline, saline + DZN, NMDA and NMDA + DZN. Cells were identified based on cell-distinguishing markers: Resting MG - GLUL, GPR37, RLBP1 (c); reactive MG – MDK, HBEGF, TGFB2 (d); microglia - C1QA, SPI1, CSF1R (e); proliferating cells (microglia and MPGCs) - TOP2A, SPC25, CDK1 (f). Glia from different treatment groups were analyzed using SingleCellSignalR to generate chord diagrams and illustrate numbers of autocrine and paracrine LR-interactions (g). The LRscore, with the most significant LR-interactions approaching a value of 1, utilizes the mean normalized read count matrix to regularize the Ligand and Receptor read counts independent of dataset depth. Paracrine LR-interactions were identified for glial cells for different treatment groups including saline (h), DZN-saline (i), NMDA (j) and DZN-NMDA (k). For each treatment group, the 40 most significant LR-interactions between microglia and MG were identified and illustrated in chord plots with LR score heat maps (h-k). Treatment-specific differences in glial paracrine LR-interactions in saline vs saline + DZN (l) and NMDA vs NMDA +DZN (m) are illustrated in Venn diagrams with select interactions. Treatment-specific differences in glial autocrine LR-interactions in MG in saline vs saline + DZN (n) and NMDA vs NMDA +DZN (o) are illustrated in Venn diagrams with select interactions.

