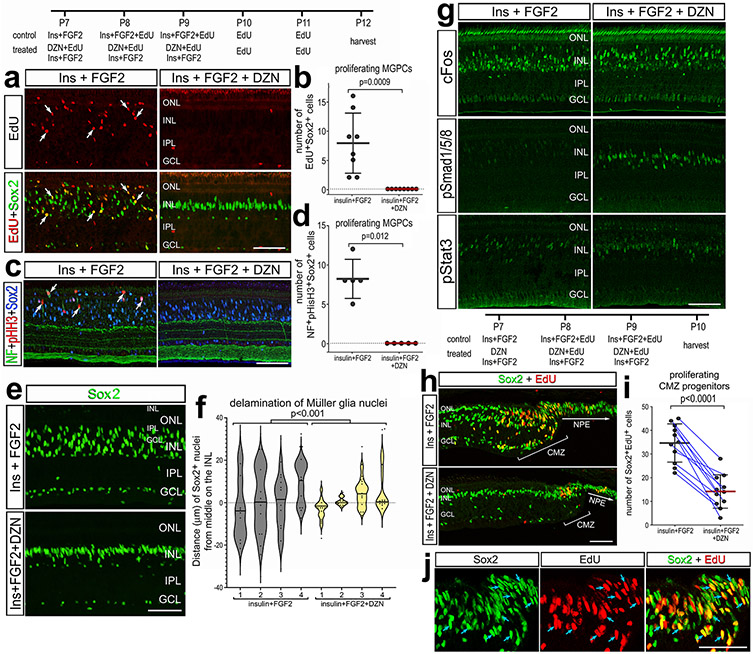
Figure 9. SAHH inhibition in retinas treated with insulin + FGF2 suppresses the proliferation of MGPCs and CMZ progenitors.
Eyes were injected with insulin+FGF2+EdU ± DZN at P7, P8 and P9, EdU at P10 and P11, and retinas harvested 24 hrs after the last injection. Sections of the retina were labeled for EdU (red; b, i, k), or antibodies to Sox2 (green; a, e, h, j; blue; c), pHisH3 (red; c), cFos (green; g), pSmad1/5/8 (green; g), or pStat3 (green; g). Sections of the far peripheral retina and CMZ were labeled for EdU (red) and Sox2 (green). White arrows indicate the nuclei of MG and blue arrows indicate nuclei in the CMZ that are double-labeled for EdU and Sox2. The calibration bars represent 50 μm. (b, d, i) Histograms represent the mean (bar±SD) and each dot represents one biological replicate (blue lines connect control and treated eyes from the same individual). The violin histogram in f represents a frequency distribution with each dot representing the position of a MG nucleus and line representing the mean for different individual retinas for each treatment. Significance of difference was determined using a Mann-Whitney U test (b, d), ANOVA (f), or paired t-test (i). Abbreviations: NPE – non-pigmented epithelium, CMZ – circumferential marginal zone, ONL – outer nuclear layer, INL – inner nuclear layer, IPL – inner plexiform layer, GCL – ganglion cell layer.

