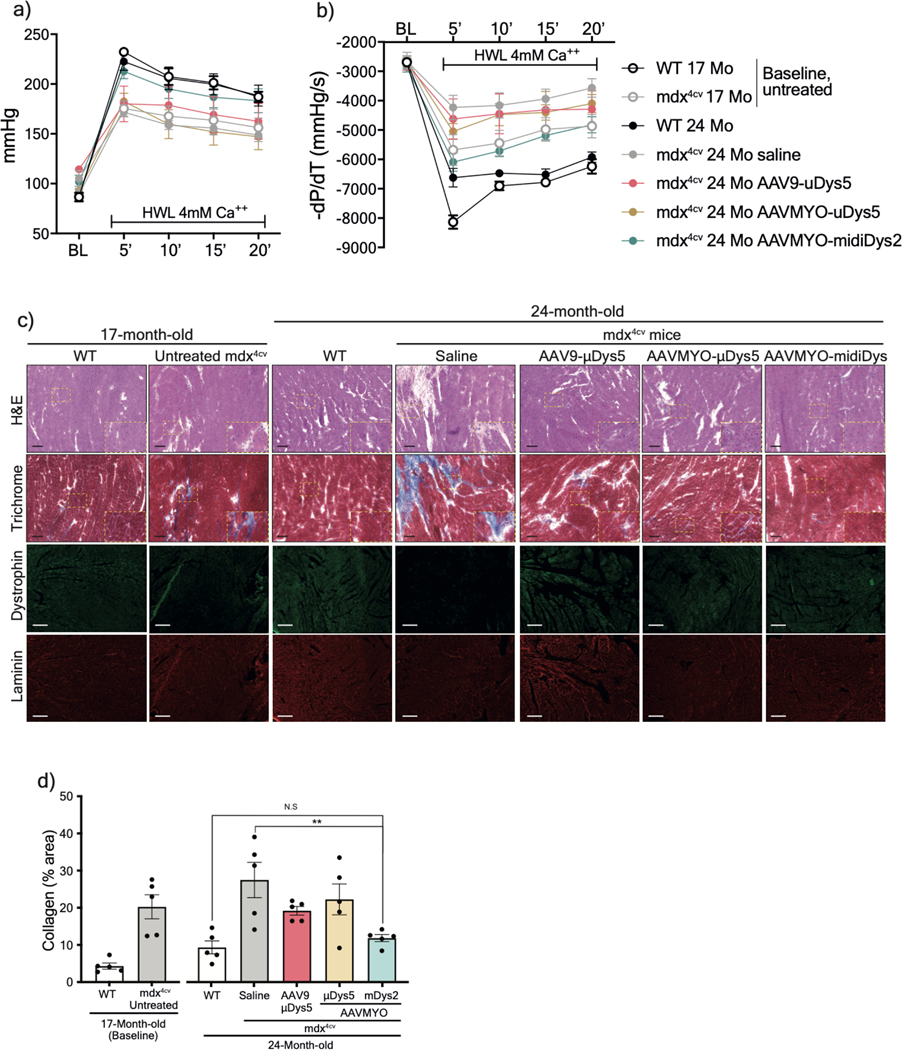
Extended Data Fig. 10: Functional and histology analyses of hearts from the old cohort.
a) The left ventricle developed pressure (the difference between systolic and diastolic pressures), and b) the negative rate of pressure change calculated by the first derivative of the descending LV pressure wave (−dP/dt) of isolated and perfused hearts were measured ex vivo at a baseline (BL), then for 20min under high workload condition (HWL) using a glucose-pyruvate buffer containing high calcium (4.0 mmol/l). Saline, AAV9-μDys: n=4, WTs; untreated, and AAV-MYO-μDys and midi-Dys2: n=6. c) Heart transverse cryosections stained with H&E, Trichrome or immunolabelled (Scale bars: 100μm) for dystrophin and laminin (Scale bars: 200μm). d) Fibrosis area measured using heart sections stained with Trichrome (n=5). data represent mean ± s.e.m. **p<0.01. (ANOVA test followed by Tukey’s post hoc).

