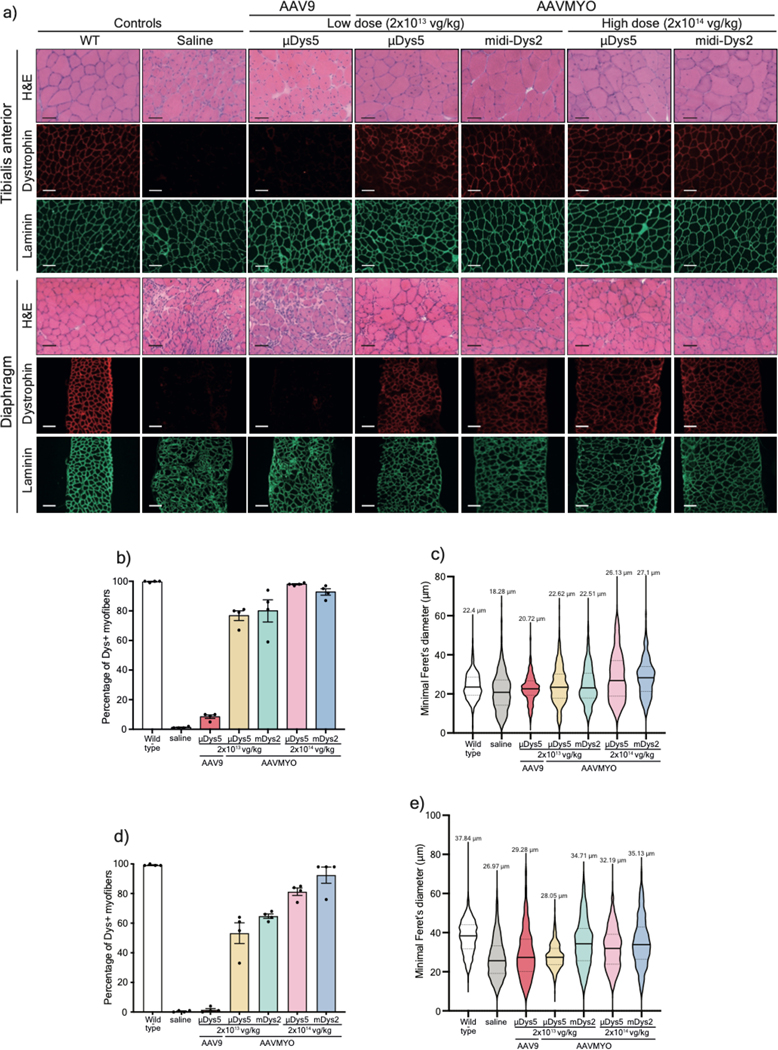
Figure 4: Muscle histology improvement following systemic delivery of AAVMYO.
a) T.A and diaphragm cross-sections stained with H&E (top rows. Scale bar: 50 μm) or immunolabeled for dystrophin (N-terminal antibody) or laminin (lower panels. Scale bar: 100 μm).
b) Percentage of dystrophin-positive myofibers determined from T.A cross-sections (n=4, more than 1000 fiber per sample). c) T.A myofiber minimal diameter measured from cross-sections stained with laminin (n=4, ~1000 fibers per sample). d) Percentage of dystrophin myofibers in diaphragm samples (n=4, more than 300 fiber per sample). e) Minimal diameter of diaphragm myofibers determined from sections stained with laminin (n=4, more than 300 fibers per sample). For b and d, Data represent means±s.e.m For c and e, the average values are shown on top of the violin bars. The solid line represents the median, while the dashed lines show the quartiles. μDys: micro-dystrophin. m-Dys: midi-dystrophin. Dys+: Dystrophin positive. vg: viral genome. kg: Kilogram

