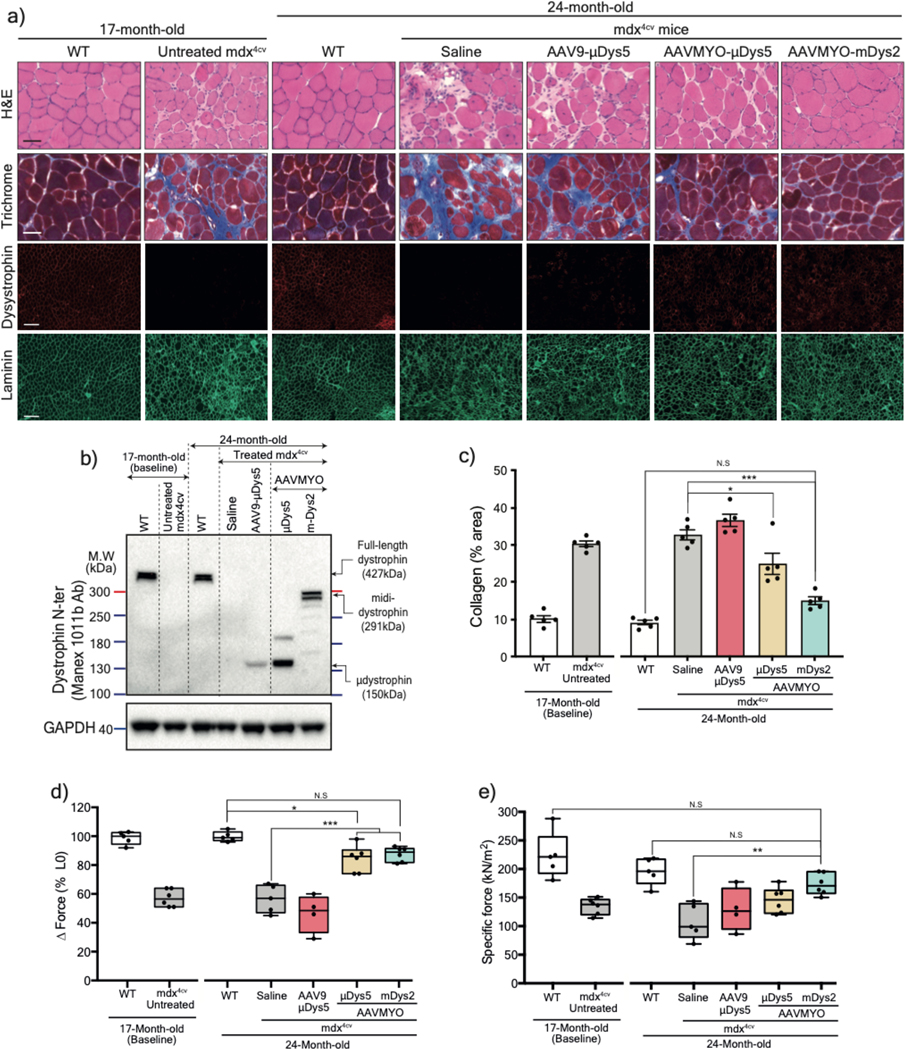
Figure 5: Long-term expression of midi-Dys2 in very old mdx4cv mice reverses skeletal muscle defect to wild-type levels.
a) T.A muscle cross-section from 17- (as baseline) or 24-month-old WT or mdx4cv stained with H&E, Trichrome (Scale bar: 50 μm, whole sections with large fields are shown in Extended data Fig. 8), or immunolabeled with antibodies against dystrophin or laminin (Scale bar: 200 μm). b) Western blot analysis of dystrophin expression with GAPDH as loading control from T.A muscle lysates. c) Quantification of fibrosis percentage measured from T.A cross-section stained with Trichrome (n=5 per group). d) Muscle forces drop measured following a 15%-stretching beyond the optimal L0. e) Maximal developed specific forces of T.A measured in situ at L0. For c and e, AAV9-μDys: n=4, control groups: n=5, AAVMYO group: n=6. Data represent means±s.e.m. N.S: no statistical significance. *p<0.05, **p<0.01 and ***p<0.001. (ANOVA test followed by Tukey’s post hoc). μDys: micro-dystrophin. m-Dys: midi-dystrophin.

