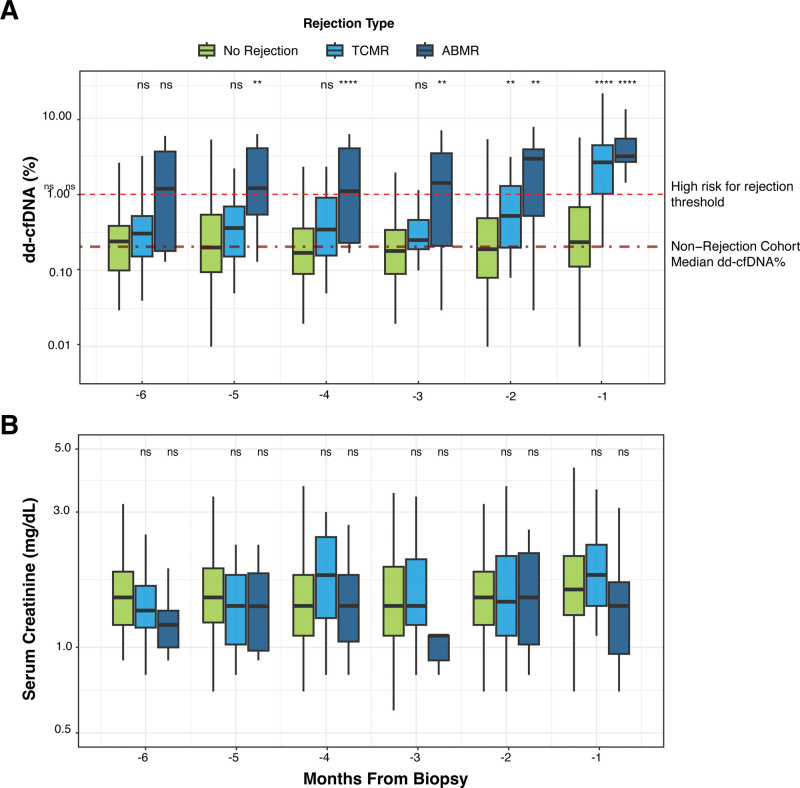
FIGURE 2.
dd-cfDNA and serum creatinine levels before BPAR. Box plots with median and interquartile range of dd-cfDNA% (A) and serum creatinine (B), shown for each biopsy diagnosis group (nonrejection, TCMR, ABMR) stratified by number of months before biopsy. A, The 2 horizontal red lines, from top to bottom, correspond to 1.0% dd-cfDNA (CLIA-validated threshold indicating high risk for rejection), and 0.23% dd-cfDNA (the median dd-cfDNA value for all samples in the nonrejection cohort). Wilcoxon rank-sum test with FDR correction for multiple testing: ****P < 1e-04, ***P < 0.001, **P < 0.01, *P < 0.05, and ns: P > 0.05. ABMR, antibody-mediated rejection; CLIA, Clinical Laboratory Improvement Amendments; dd-cfDNA, donor-derived cell-free DNA; TCMR, T cell–mediated rejection.

