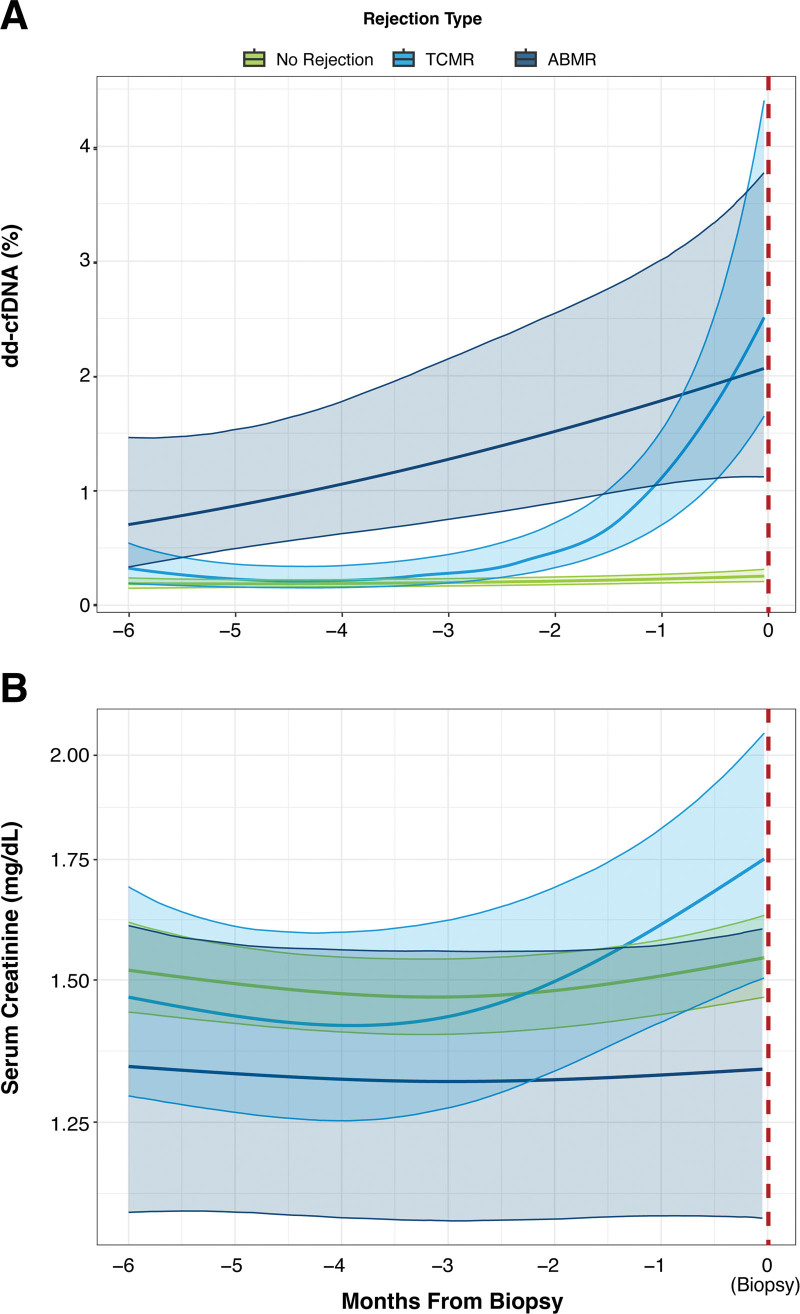
FIGURE 3.
dd-cfDNA and serum creatinine trends before biopsy. Estimated population means for (A) dd-cfDNA levels and (B) serum creatinine stratified by biopsy result (no rejection, TCMR, or ABMR). Thick lines represent the regression fit, and shaded regions indicate 95% confidence intervals. ABMR, antibody-mediated rejection; dd-cfDNA, donor-derived cell-free DNA; TCMR, T cell–mediated rejection.

