Figure 2.
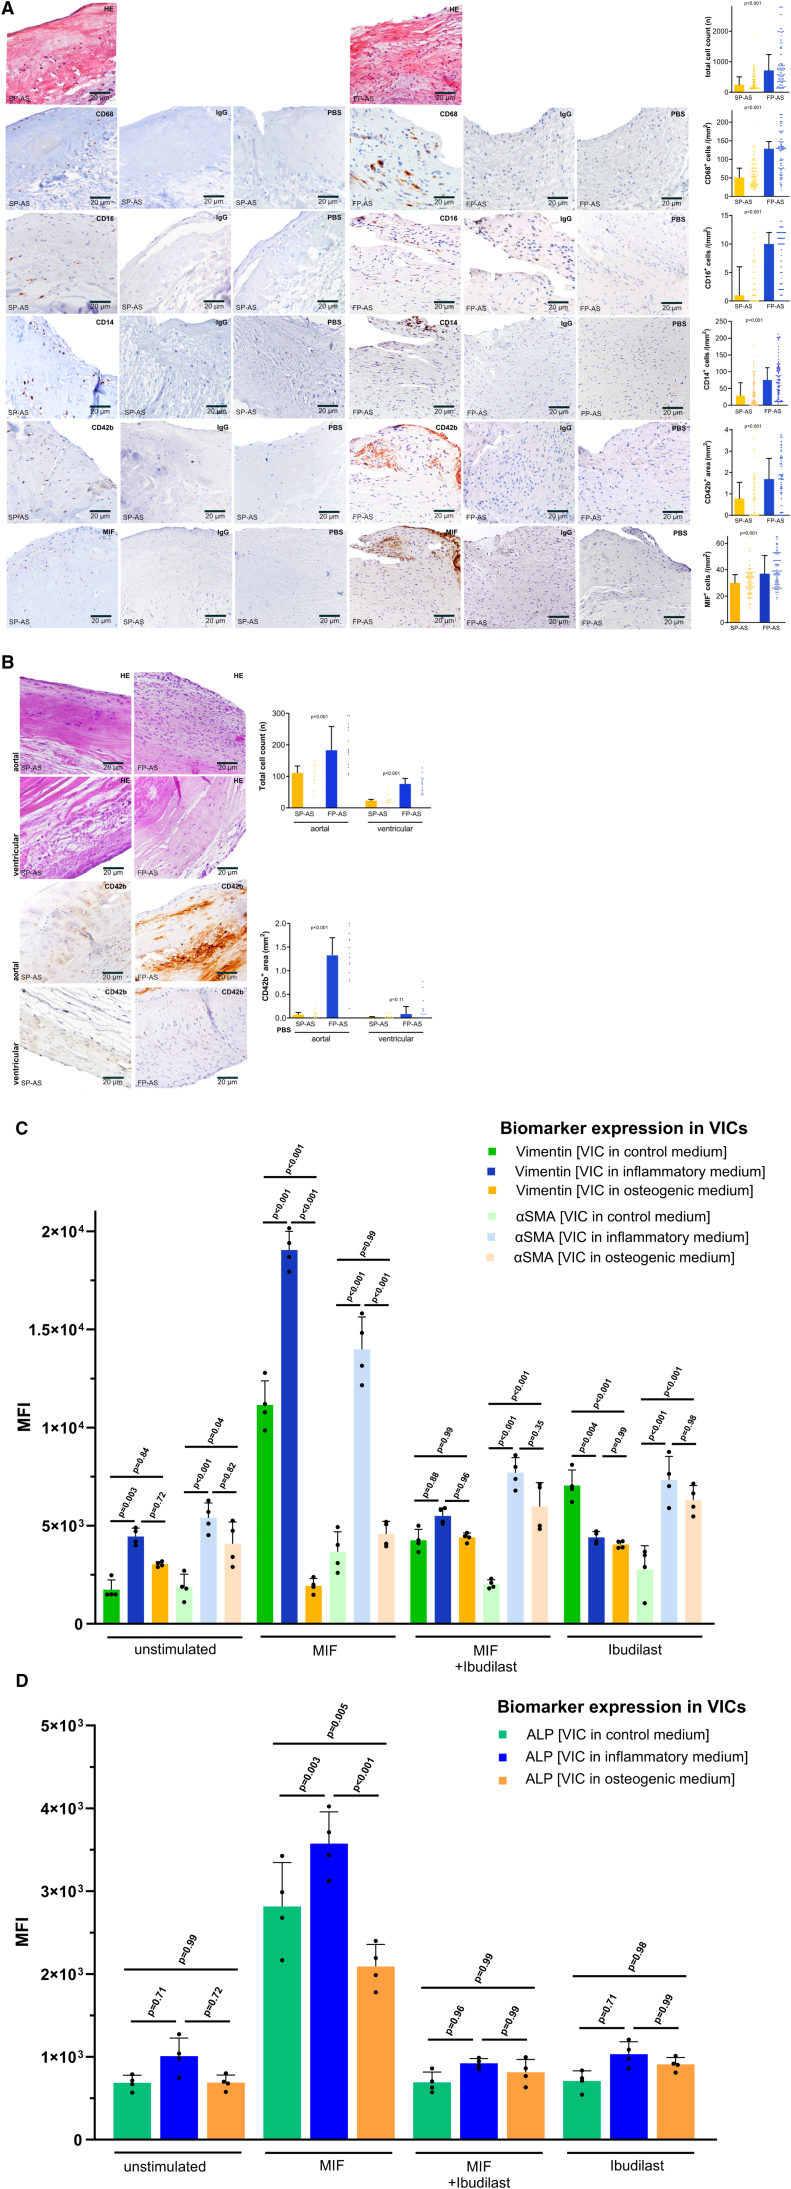
Fast-progressive aortic stenosis (FP-AS) and slow-progressive aortic stenosis (SP-AS) show typical valvular expression patterns of valve infiltrating inflammatory cells, platelets, and macrophage MIF (macrophage migration inhibitory factor). A, Representative immunohistological stainings of SP-AS (n=110) and FP-AS (n=108) to calculate the total aortic valve cell count (n), CD68+ macrophages, CD16+ monocytes, CD14+ monocytes, CD42b+ platelets, and MIF+ staining in matching areas of consecutive aortic valve (AV) tissue sections. Plotted: median±interquartile range (IQR); statistics: Mann-Whitney U test. B, Representative immunohistological stainings comparing aortal and ventricular aortic valve side in SP-AS (n=11) and FP-AS (n=14) to analyze the cell count (n) and CD42b+ positive areas in the aortal and the ventricular side of the AV. Plotted: median±IQR; statistics: Kruskal-Wallis test. C, In vitro analysis of cell culture of valvular interstitial cells (VICs) in control, proinflammatory, and pro-osteogenic medium. Vimentin and αSMA expression on VICs in control, proinflammatory, and pro-osteogenic medium without stimulation, under stimulation with MIF, coincubation with MIF and its antagonist ibudilast, and under inhibition by ibudilast. Plotted: mean±SD, n=4; statistics: 1-way ANOVA. Tukey multiple comparison test (P<0.05) was used to correct for multiple comparisons. D, ALP (alkaline phosphatase) expression on VICs in control, proinflammatory, and pro-osteogenic medium without stimulation, understimulation with MIF, coincubation with MIF and its antagonist ibudilast, and under inhibition by ibudilast. Proinflammatory and pro-osteogenic medium mimic an inflammatory (FP-AS) or calcifying (SP-AS) valvular and systemic phenotype as described before. Plotted: mean±SD, n=4; statistics: 1-way ANOVA. Tukey multiple comparison test (P<0.05) was used to correct for multiple comparisons. HE indicates hematoxylin and eosin.

