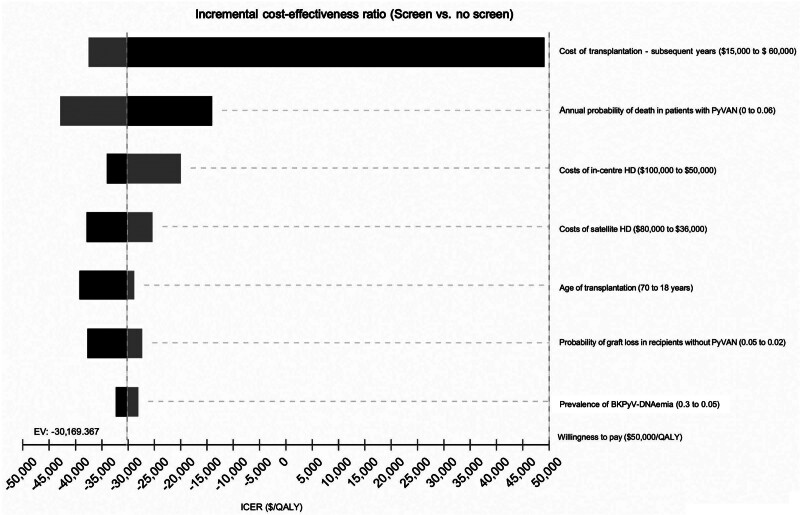
FIGURE 3.
One-way sensitivity analyses: tornado diagram showing the influential variables on the incremental cost-effectiveness ratio in the base case model. The tornado diagram indicates the extent of the variability associated with these important variables on the incremental health benefits and costs. For example, if the age of transplantation is decreased from 70 y (shades of black) to 18 y (shades of gray), the incremental benefits of screening would increase from 0.20 to 0.24 QALYs. However, the total savings will be reduced from $7884 to $6844, as younger recipients would incur greater resources used over their lifetime compared with their older counterparts because of their longer expected posttransplant survival. EV, expected value; HD, hemodialysis; ICER, incremental cost-effectiveness ratio; PyVAN, polyomavirus-associated nephropathy; QALY, quality-adjusted life year. Adapted from Wong et al.353

