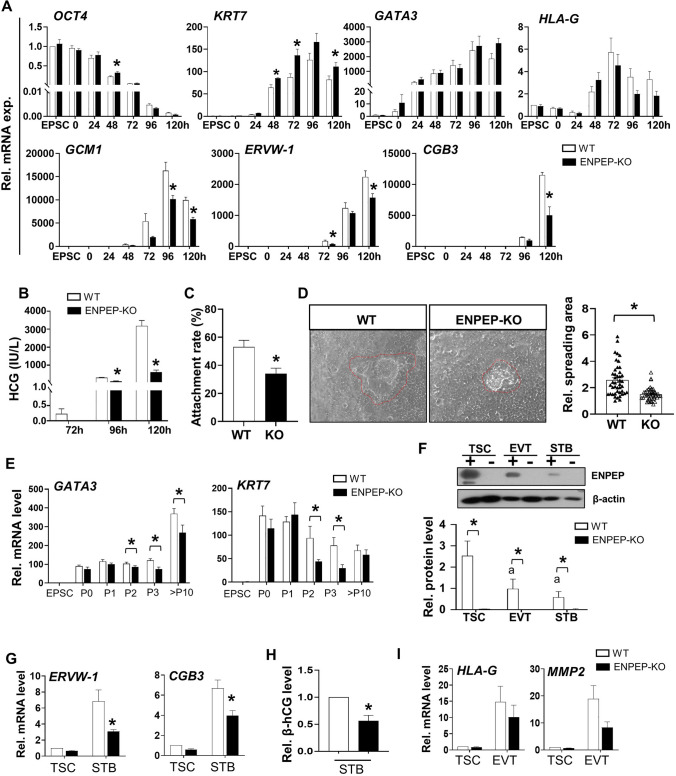
Fig. 4.
Deletion of ENPEP impaired trophoblast differentiation from hEPSC-em. A The relative mRNA expression of pluripotent marker (OCT4), early trophoblast markers (KRT7 and GATA3), EVT marker (HLA-G) and STB markers (GCM1, ERVW-1 and CGB3) as determined by RT-qPCR in trophoblastic spheroids generated from WT and ENPEP-KO hEPSC-em. (n = 3–4). B The β-hCG secretion levels in the conditioned media of trophoblastic spheroids from 72 to 120 h (n = 3). C The attachment rates of WT and ENPEP-KO hEPSC-em derived trophoblastic spheroids at 72 h after 1 h of coculture with receptive Ishikawa cells (n = 5). D Representative pictures of trophoblastic spheroids cocultured with Ishikawa cells for 24 h (left) and the spreading area of trophoblastic spheroids. E The relative mRNA expression of TSC markers (GATA3 and KRT7) during TSC derivation from WT and KO hEPSC-em at passage 0–3 and passage 10–12 (n = 4). F Western blotting analysis of ENPEP protein levels in TSC, EVT and STB differentiated from TSC (n = 4). G, H The relative mRNA expressions of STB markers (ERVW-1 and CGB3) as determined by RT-qPCR (n = 4–5) (G) and the β-hCG secretion levels in the spent culture media of differentiated STB from WT and KO TSC-em as detected by enzyme immunoassay (n = 6) (H). I The relative mRNA expressions of EVT markers (HLA-G and MMP2). Data were presented as mean ± SEM. t-test was performed for gene and protein expression analysis. Mann–Whitney U test was used for the analysis of attachment rates and β-hCG levels. ap < 0.05 when compared to WT hEPSC-em or WT TSC-em; *p < 0.05 pairwise comparison between WT and ENPEP-KO group at the same time points

