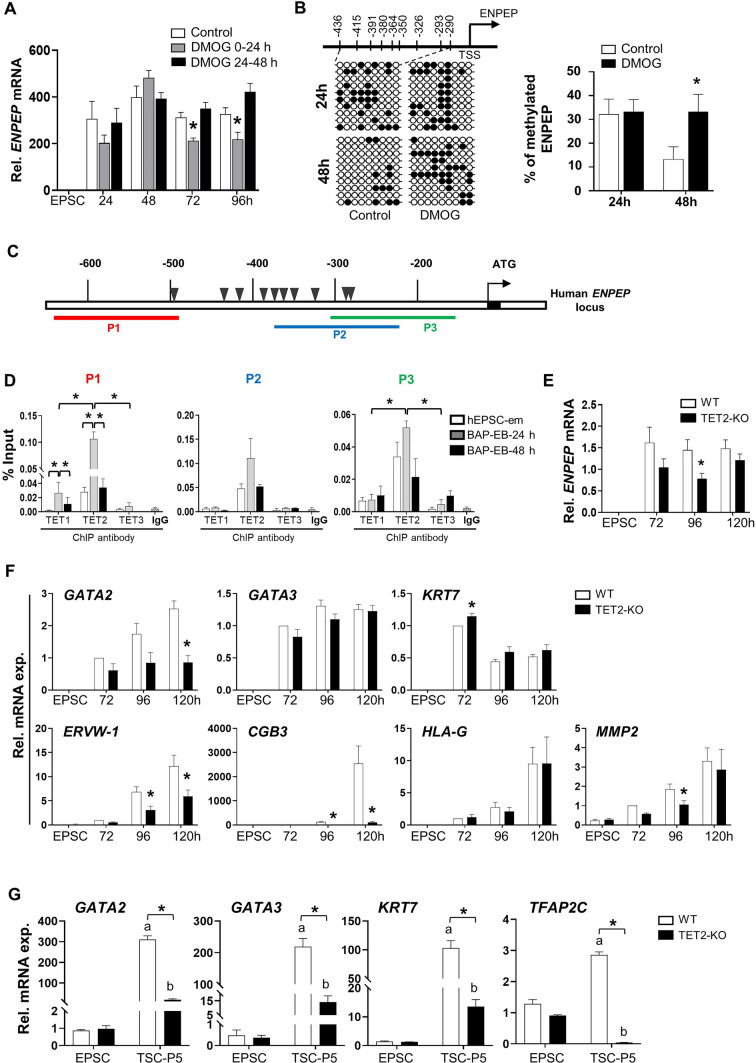
Fig. 5.
TET2 mediated ENPEP expression and its role during trophoblast differentiation. A The relative mRNA expression of ENPEP after treatments with 40 μM DMOG at different time points during BAP-induced differentiation (n = 3). B Representative bisulfite sequencing results (left) and the average percentages of methylated cytosines (right) of ENPEP promoter in untreated (control) and DMOG treated groups at 24 h and 48 h during BAP-induced trophoblast differentiation. Each horizontal line representing the sequencing result of one clone. Filled circles and open circles represented the methylated and unmethylated CpG dinucleotide, respectively. C Schematic diagram showing the positions of the primer pairs (P1, P2 and P3) of human ENPEP promoter used for ChIP-qPCR analysis. CpG sites were denoted as triangles. D ChIP-qPCR results showing the relative enrichment of ENPEP promoter DNA by antibodies against TET1, TET2 and TET3 proteins. IgG of the same species were included as the controls for ChIP analysis (lower panel) (n = 3). E The relative mRNA expression of ENPEP in TET2-WT and TET2-KO hEPSC-em derived trophoblasts (n = 4). F The relative mRNA expression of early trophoblast markers (GATA2, GATA3 and KRT7), STB markers (ERVW-1 and CGB3) and EVT marker (HLA-G and MMP2) during BAP-induced trophoblast differentiation from WT and TET2-KO hEPSC-em lines (n = 5). G The relative mRNA expression of TSC markers (GATA2, GATA3, KRT7 and TFAP2C) at passage 5 during TSC derivation from WT and TET2-KO hEPSC-em. The data were presented as mean ± SEM. Mann–Whitney U test was performed for DNA methylation analysis. t-test was performed for gene expression analysis. ap < 0.05 when compared to WT hEPSC-em; bp < 0.05 when compared to TET2-KO hEPSC-em; *p < 0.05 compared between WT and TET2-KO

