Fig. 2.
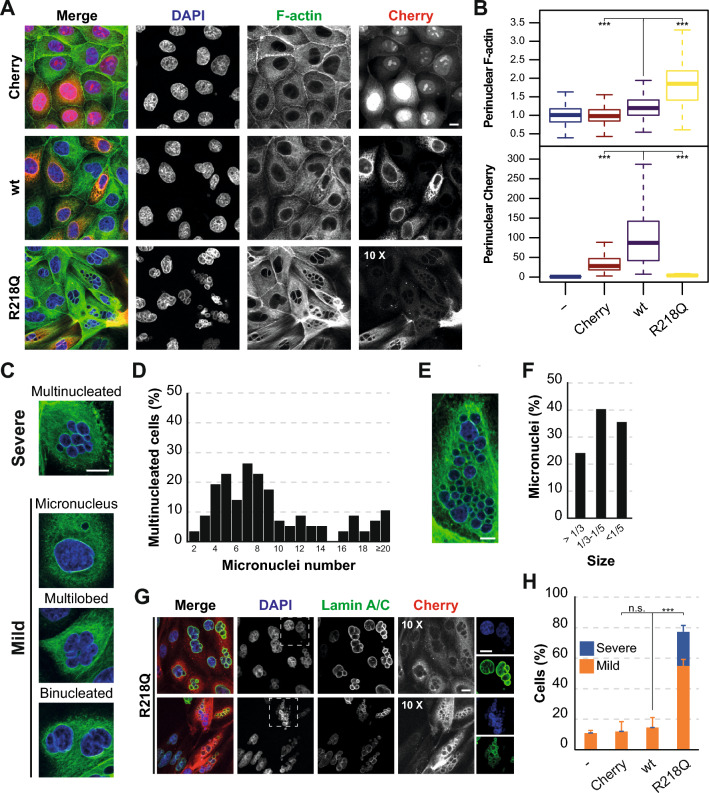
Nuclear morphology of INF2 R218Q MDCK cells. A F-actin staining of Cherry, wt INF2 and INF2 R218Q cells. The contrast in the Cherry channel was increased as indicated to visualize the cells expressing INF2 R218Q. B Box plots depicting staining intensity of F-actin and the indicated Cherry proteins at the perinuclear region of three equatorial planes relative to that of untreated cells. The perinuclear Cherry content was normalized to the background intensity value of untreated cells. At least 150 cells were analyzed for each experimental condition in three independent experiments. C Classification of abnormal classes of nuclear morphologies observed. D Percentage of multi-micronucleated cells with the indicated numbers of micronuclei. E Image of an INF2 R218Q cell with over 40 micronuclei. F Percentage of micronuclei with size > 1/3, 1/3–1/5 and < 1/5 of the mean nuclear diameter of a normal mononucleated cell. 114 multi-micronucleated cells were analyzed in D, F. G Images of INF2 R218Q cells stained for lamin A/C. H Percentage of untreated, Cherry, wt INF2 and R218Q cells with mild or severe nuclear phenotypes. Over 450 cells were analyzed for each experimental condition in three independent experiments. Nuclei were visualized using DAPI. Scale bars, 10 μm. n.s., not significant; ***, p < 0.001

