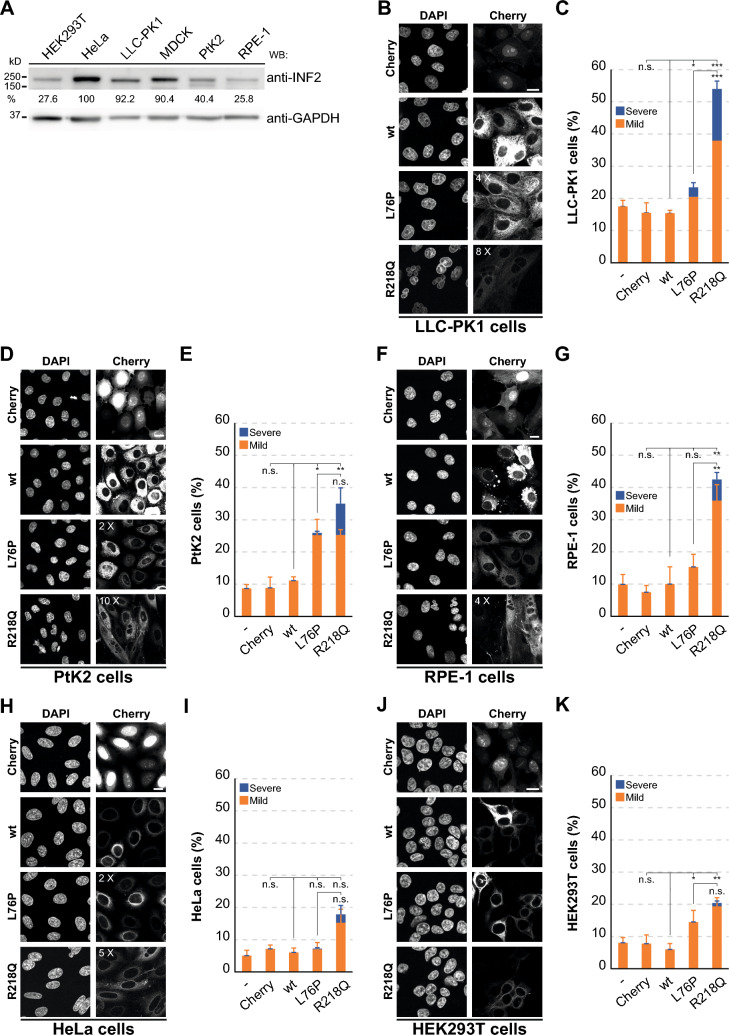
Fig. 3.
Nuclear phenotype in a panel of cell lines expressing pathogenic INF2. A Endogenous INF2 expression analyzed by immunoblotting with anti-INF2 antibodies in the indicated cell lines, using GAPDH as a loading control. The numbers show the percentage of INF2 levels in the different cell lines relative to those in HeLa cells, which had the highest level of expression. B–K Images of an equatorial plane of the indicated cell lines expressing Cherry alone or Cherry fused to wt, L76P, and R218Q INF2 (B, D, F, H, J), and quantification of the percentage of cells displaying mild or severe nuclear phenotypes (C, E, G, I, K). More than 450 cells were analyzed per cell line and condition; three independent experiments. The contrast in the Cherry channel was increased as indicated to identify the cells expressing pathogenic INF2. Nuclei were visualized using DAPI. Scale bars, 15 μm. n.s., not significant; *, p < 0.05; **, p < 0.01; ***, p < 0.001

