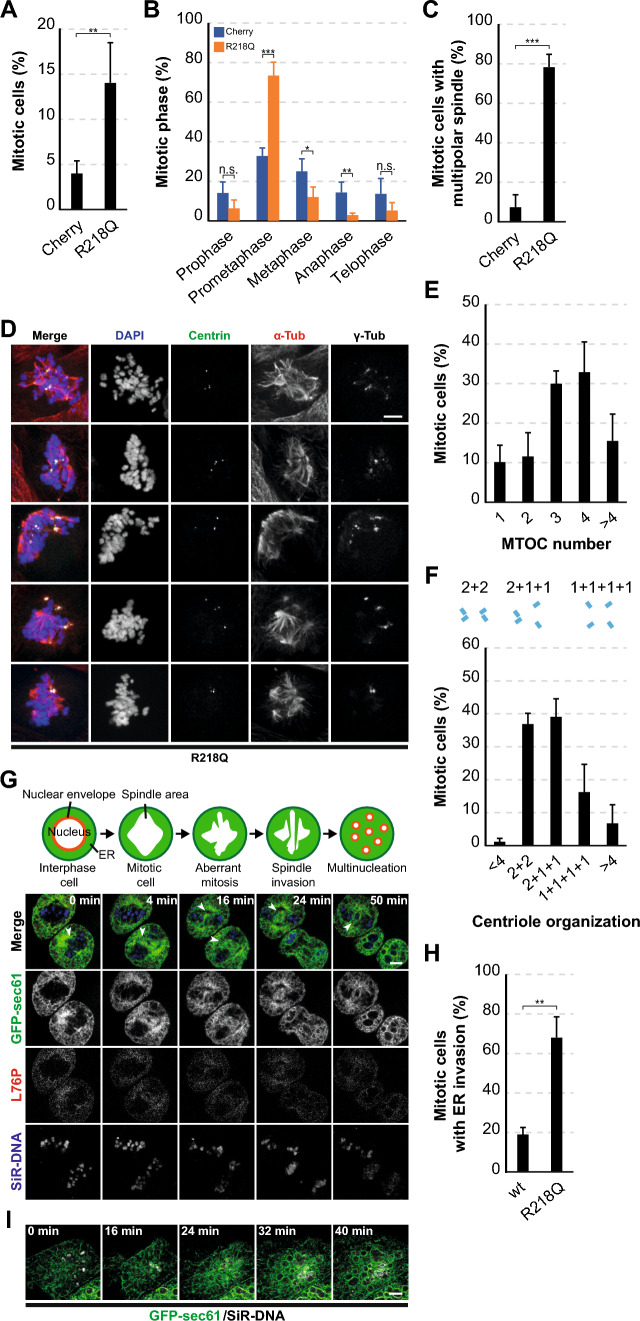
Fig. 4.
INF2 R218Q induces the formation of multipolar spindles in MDCK cells. A Percentage of Cherry and INF2 R218Q cells in mitosis after 48 h of expression. More than 1000 cells were analyzed for each experimental condition in five independent experiments. B Distribution of Cherry and INF2 R218Q cells across different phases of the cell cycle. More than 200 cells were analyzed for each experimental condition, four independent experiments. C Percentage of mitotic Cherry and INF2 R218Q cells displaying multipolar spindles. 68 Cherry cells and 152 INF2 R218Q cells were examined; four independent experiments. D Images of INF2 R218Q mitotic cells stained for centrin, α-tubulin and γ-tubulin. Nuclei were visualized using DAPI. E Classification of INF2 R218Q mitotic cells based on the number of MTOCs expressed as percentage of total cells. MTOCs were identified by γ-tubulin and α-tubulin staining. Over 200 cells were examined; four independent experiments. F Top: Schematic of centriole arrangements. Bottom: centriole arrangement, as visualized with centrin, in INF2 R218Q mitotic cells categorized as clustered in two centrosomes (2 + 2), disengaged in one (2 + 1 + 1) or both (1 + 1 + 1 + 1) centrosomes, or with an abnormal number of centrioles, presented as a percentage of total cells. More than 170 cells were examined; three independent experiments. G Top panel: schematic of ER invasion of the spindle space in cells expressing pathogenic INF2. Bottom panels: INF2 L76P cells stably expressing GFP-sec61 and stained with SiR-DNA analyzed by videomicroscopy during mitosis. The arrowheads indicate regions of the mitotic spindle invaded by ER membranes. H The graph shows the percentage of wt INF2 and INF2 R218Q cells with the spindle space invaded by ER membranes. More than 80 cells were analyzed; three independent experiments. I Videomicroscopic analysis of INF2 R218Q cells stably expressing GFP-sec61 and stained with SiR-DNA during formation of multiple micronuclei. Scale bars, 5 μm. n.s., not significant; *, p < 0.05; **, p < 0.01; ***, p < 0.001

