Fig. 9.
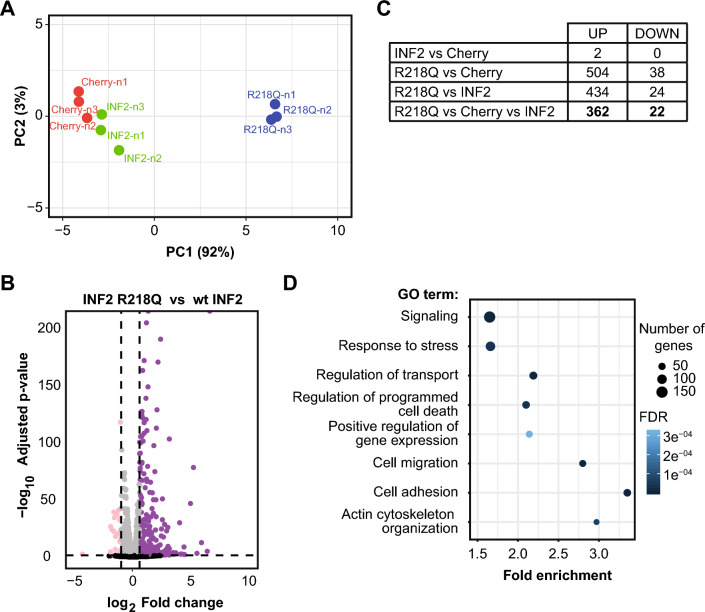
INF2 R218Q-induced transcriptome reprogramming. A Principal component analysis illustrating intragroup and intergroup variability across RNA-seq datasets from wt INF2, INF2 R218Q, and Cherry MDCK cells. B Volcano plot depicting significantly depleted (pink) and enriched (purple) mRNAs found in INF2 R218Q cells relative to wt INF2 cells. The discontinuous vertical lines indicate the thresholds used: 1.5-fold for upregulated and 0.5-fold for downregulated genes. The discontinuous horizontal line indicates the threshold of p < 0.05. Black, genes with p > 0.05. C Count of differentially expressed genes in INF2 R218Q cells with ≥ 50% difference of expression levels and p < 0.05. D Gene ontology analysis of the genes differentially expressed in INF2 R218Q cells. Only the 384 genes selected in (C) were considered

