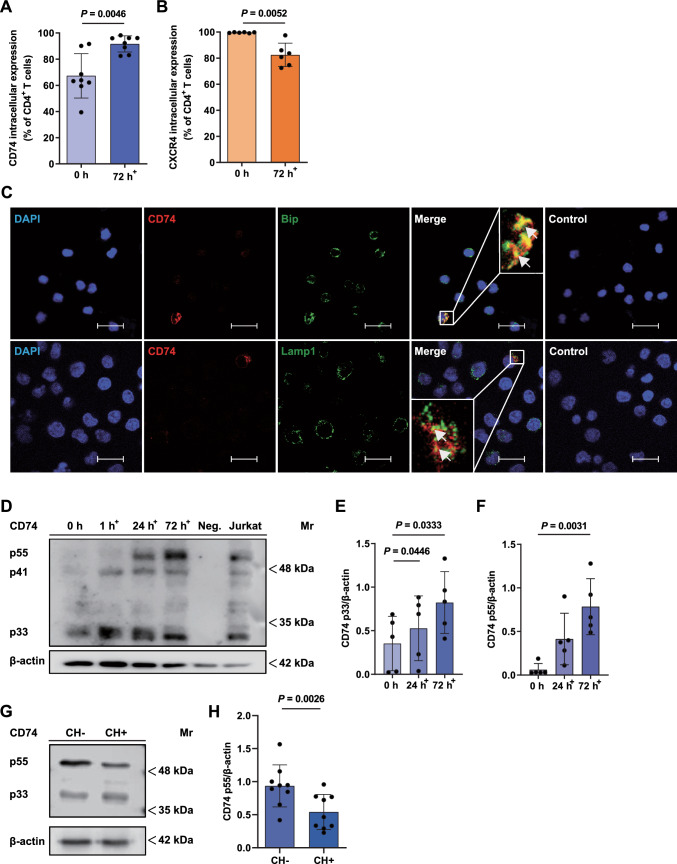
Fig. 2.
Constitutive expression and intracellular localization of CD74 in CD4+ T cells. A, B CD74 and CXCR4 expression in permeabilized CD4+ T cells before and after activation. Intracellular CD74 and CXCR4 expression was evaluated by flow cytometry of permeabilized freshly isolated (0 h) and 72 h-activated CD4+ T cells. Percentages of CD74+ (n = 8) and CXCR4+ (n = 6) cells are shown as means ± SD with individual datapoints representing independent donors. Statistical differences between the 0 h and 72 h time points were analyzed by paired student’s t-test. C Localization of CD74 in the endoplasmic reticulum (ER) and endolysosomal compartments. Immunofluorescent staining of CD74 (red) together with an ER (BiP, upper row, green) or lysosomal marker (LAMP1, bottom row, green) in 72 h in vitro activated and permeabilized CD4+ T cells imaged via CLSM (scale bar = 20 µm). Cell nuclei were counterstained with DAPI (blue). Samples stained with secondary antibodies alone served as controls. Arrows mark exemplary overlapping signals (yellow). Images shown are representative of three separate experiments. D–F CD74 protein expression in the course of CD4+ T-cell activation evaluated by SDS-PAGE/WB. CD4+ T cells were purified and lysed before (0 h) or after 1 h, 24 h or 72 h of in vitro T-cell activation following SDS-PAGE and WB analysis for CD74 and β-actin protein expression. Neutrophil cell lysates served as a negative control (Neg.), CD74 protein content of the Jurkat cell line was assessed without prior activation. OD values of the detected p33 and p55 CD74 isoforms before and after 24 h and 72 h of T-cell activation were determined and normalized to β-actin. Upregulation of the p33 and p55 isoforms is displayed as columns (means ± SD) with individual data points (n = 5). For comparison of 24 h and 72 h timepoints to 0 h control, statistical differences were analyzed by one-way ANOVA with Dunnett post-hoc test for E and Friedman test with Dunn post-hoc test for F. 1 h+, 24 h+, 72 h+ indicate the respective time of in vitro T-cell activation in A–F. G, H Evaluation of CD74 protein expression before and after chondroitinase treatment. 72 h-activated CD4+ T cells were lysed and treated with (CH+) or without (CH–) chondroitinase. SDS-PAGE and WB was performed as before for detection of CD74 and β-actin protein expression. Quantification of OD values of CD74 p55 in CH+ s. CH- samples normalized to β-actin displayed as bar chart (means ± SD) with individual data points (n = 9). Statistical differences were analyzed by paired student’s t-test. For all bar diagrams, statistical significance is indicated by actual P values.

