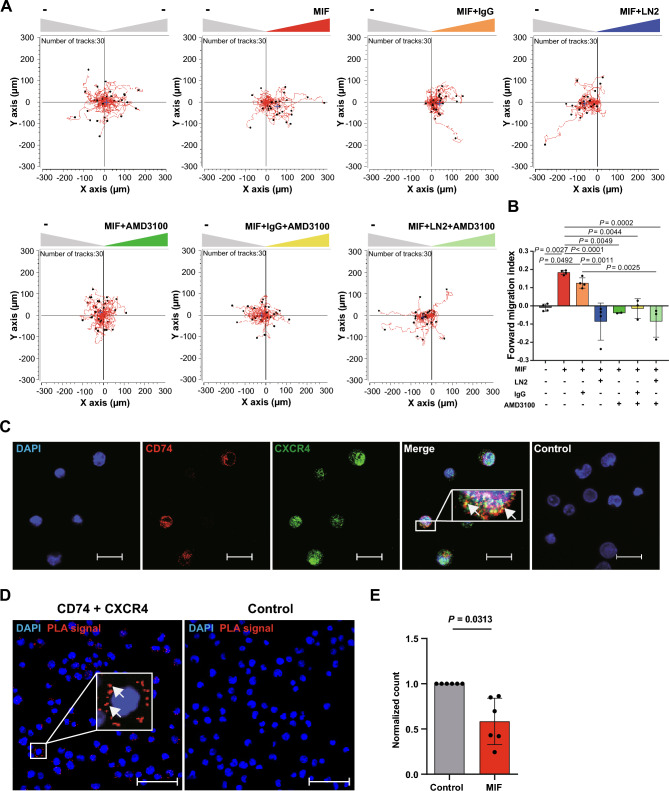
Fig. 5.
Involvement of CD74 and CXCR4 in MIF-mediated CD4+ T-cell chemotaxis. A Both MIF receptors CXCR4 and CD74 are required for MIF-elicited migration of activated CD4+ T cells as assessed by 3D chemotaxis assay. Representative trajectory plots (x, y = 0 at time 0 h) of migrated activated CD4+ T cells (72 h) in a three-dimensional (3D) aqueous collagen-gel matrix towards a MIF chemoattractant gradient (MIF concentration: 200 ng/ml, –: control medium) that was established in presence or absence of a CD74 neutralizing antibody, a corresponding isotype control (IgG) or the CXCR4 receptor inhibitor AMD3100. Cell motility was monitored by time-lapse microscopy for 2 h at 37 °C, images were obtained every minute using the Leica DMi8 microscope. Single cell tracking was performed of 30 cells per experimental group. The blue crosshair indicates the cell population’s center of mass after migration. B Quantification of the 3D chemotaxis experiment in A showing inhibition of MIF-induced CD4+ T-cell migration upon co-incubation with CD74 neutralizing antibody and AMD3100 either alone or in combination. Plotted is the calculated forward migration index (FMI, means ± SD) based on manual tracking of at least 30 individual cells per treatment (n = 2–4). Statistical differences were analyzed by one-way ANOVA with Tukey post-hoc test and indicated by actual P values. C Cell surface colocalization of the MIF receptors CD74 and CXCR4 on activated CD4+ T cells. Immunofluorescent cell surface staining of CD74 (red) and CXCR4 (green) either alone or in combination on 72 h-activated CD4+ T cells imaged via CLSM (scale bar = 20 µm). Cell nuclei were counterstained with DAPI (blue). Samples stained with secondary antibodies alone served as controls. Images shown are representative of two independent experiments. D, E Proximity ligation assay indicating CD74/CXCR4 heterocomplex formation and MIF dependent internalization. D Display of a representative PLA result visualizing the interaction of CD74 and CXCR4 on the cell surface of 72 h-activated CD4+ T cells (red dots indicating positive PLA signal; imaged via CLSM; 40 × objective, DAPI, blue; scale bar: 50 µm). E Quantification of CD74/CXCR4 heterocomplexes on the cell surface of 72 h-activated CD4+ T cells upon stimulation with MIF (200 mg/ml) prior to fixation (means ± SD of PLA dots /cell normalized to control, n = 6). Statistical differences were analyzed by Wilcoxon matched-pairs signed-rank test and indicated by actual P values

