Fig. 1.
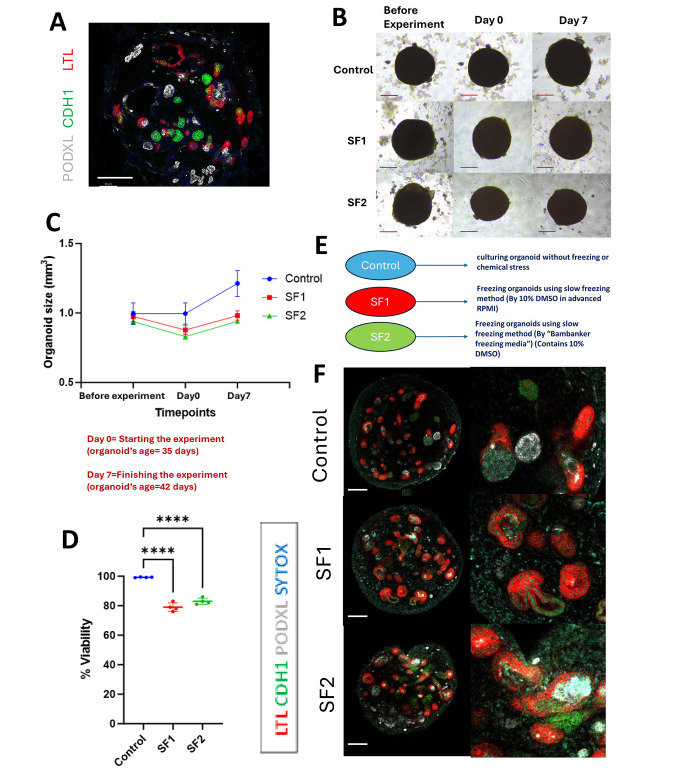
Characterization of kidney organoids following slow freezing: size, viability, and staining. (A) An immunostaining representation of a kidney organoid featuring tubular and glomerular structures. Scale bar: 100 μm. (B) These images depict the light microscopy views of each condition captured at three distinct time points throughout the experiment: Before freezing (before freezing organoids on day 35 of differentiation), Day 0 (just after thawing), and Day 7 (after 7 days of culture after thawing, equivalent to day 42 of differentiation). Scale bar, 50 μm (bottom). (C) A graph depicting kidney organoid sizes across three distinct conditions (Control, SF1, and SF2) at three different time points. The kidney organoids utilized in this study were of the BJFF type, and their age at Day 0 was 35 days. (D) A graph representing cell viability across three conditions on Day 0 of thawing, immediately after thawing from the slow freezing conditions. Viability assessment involved the use of trypsin EDTA to disassemble organoid structures into single cells for cell counting with Trypan Blue ****P < 0.0001.(E) An exposition of the three conditions within this particular phase of the experiment is warranted. (F) Immunostaining images for the assessment of proximal tubules (LTL), loops of Henle, distal tubules, and connecting tubules (CDH1), and podocytes (PODXL) in kidney organoids on day 42 of differentiation with or without slow freezing. Scale bars: 100 μm

