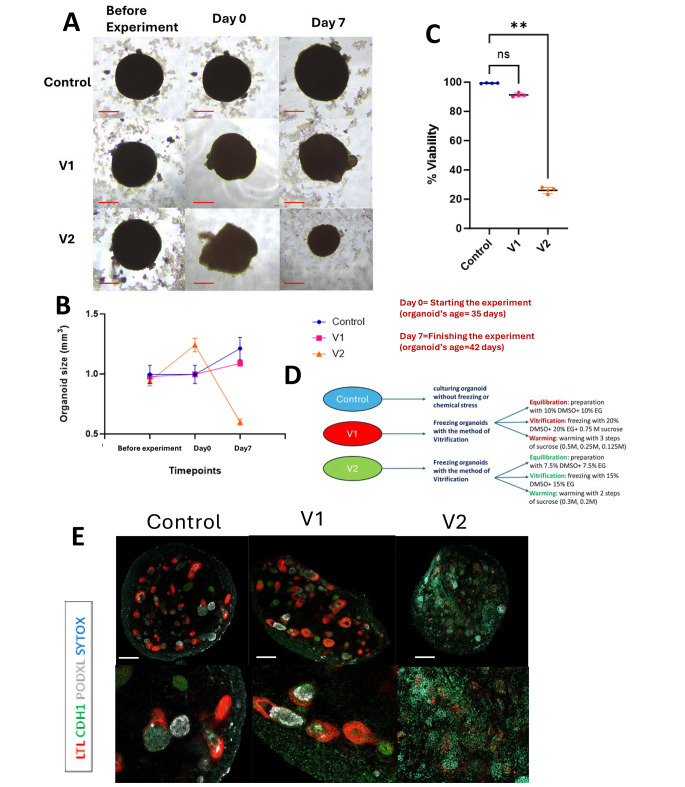
Fig. 3.
Impact of vitrification on kidney organoids: structural integrity, viability, and size evaluation. (A) The bright field images of live organoids in each condition at three distinct time intervals during the course of the experiment: prior to commencement, Day 0 (initiation of the experiment), and Day 7 (conclusion of the experiment). In the context of freezing conditions, Day 0 denotes the stage post-thawing within the experimental setup. Scale bars: 50 μm (bottom). (B) A graph depicting kidney organoid sizes across three different conditions (Control, V1, and V2) at three time points: pre-experimentation, the commencement of the experiment (referred to as Day 0, post-thawing for freezing conditions), and Day 7, signifying the termination of the experimental period. (C) A graph presenting cell viability across three conditions at Day 0, immediately subsequent to thawing for the vitrification freezing conditions. Viability evaluation entailed the utilization of trypsin EDTA to disassemble organoid structures into individual cells. The average cell viability percentage for the control condition was recorded at 99.4%. The cellular viability in the V1 condition closely resembled that of the control group, registering 91%, with no statistically significant variance observed. In contrast, V2 exhibited substantial cellular damage, with a viability of 26%, demonstrating a significant disparity with ** P < 0.01. (D) A depiction of the three experimental conditions in this section of the experiment (E) Immunocytochemistry for proximal tubule (LTL), distal tubule (CDH1), and podocyte (PODXL) across all conditions on day 42 of differentiation. Scale bars: 100 μm

