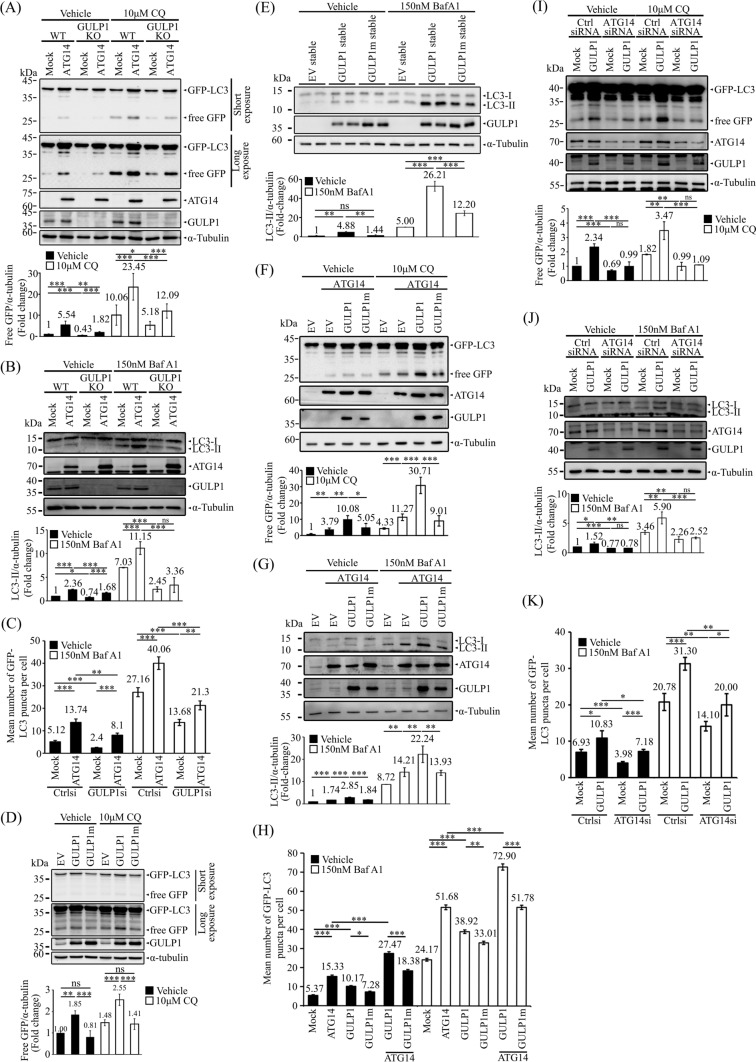
Fig. 3.
GULP1 potentiates ATG14-mediated autophagy. A Representative immunoblots for free GFP in WT and GULP1-KO HEK293 cells transfected with GFP-LC3 and treated as indicated. GFP fusion proteins, ATG14 and GULP1 were detected with anti-GFP JL-8, a mouse anti-FLAG antibody and anti-GULP1 G-R3 respectively. α-tubulin was detected with anti-tubulin DM1A and used as a loading control. Bottom: quantification of relative GFP levels against loading control α-tubulin. Bottom: densitometric quantification of relative GFP levels against α-tubulin. *p < 0.05, **p < 0.01, ***p < 0.001. B Representative immunoblots for LC3 from WT and GULP1 KO HEK293 cells transfected with ATG14 together with mock or ATG14. GULP1 were detected with anti-LC3 14600-1-AP, a mouse anti-FLAG antibody and an anti-GULP1 G-R3 respectively. α-tubulin was detected with anti-tubulin DM1A and used as a loading control. Bar chart shows the densitometric quantification of relative LC3-II levels against loading control α-tubulin. **p < 0.01, ***p < 0.001. ns not significant. C Quantification of GFP-LC3 puncta plotted by different transfection and treatment as indicated. Data was obtained from at least 40 cells per transfection, and the experiment was repeated three times. Error bars are sem. *p < 0.05, **p < 0.01, ***p < 0.001. D Representative immunoblots for free GFP in HEK293 cells stably transfected with EV, GULP1 and GULP1m and treated as indicated. GFP fusion proteins and GULP1 were detected with anti-GFP JL-8 and anti-GULP1 G-R3 respectively. α-tubulin was detected with anti-tubulin DM1A and used as a loading control. Bottom: quantification of relative GFP levels against loading control α-tubulin. Bottom: densitometric quantification of relative GFP levels against α-tubulin. *p < 0.05, **p < 0.01, ***p < 0.001. E Representative immunoblots for LC3 from EV, GULP1 and GULP1m stably transfected HEK293 cell lysates treated as indicated. LC3 and GULP1 were detected with anti-LC3 14600-1-AP and anti-GULP1 G-R3 respectively. α-tubulin was detected with anti-tubulin DM1A and used as a loading control. Bar chart shows the densitometric quantification of relative LC3-II levels against loading control α-tubulin. **p < 0.01, ***p < 0.001. ns not significant. F Immunoblotting of free GFP in HEK293 cells stably transfected with EV, GULP1 and GULP1m and transiently transfected with ATG14 and treatment as indicated. GFP fusion proteins, ATG14 and GULP1 were detected with anti-GFP JL-8, a mouse anti-FLAG antibody and an anti-GULP1 G-R3 respectively. α-tubulin was detected with anti-tubulin DM1A and used as a loading control. Bottom: quantification of relative GFP levels against loading control α-tubulin. Bottom: densitometric quantification of relative GFP levels against α-tubulin. *p < 0.05, **p < 0.01, ***p < 0.001. G Representative immunoblots for LC3 from HEK293 cells transfected with ATG14 together with EV, GULP1 or GULP1m. LC3, ATG14 and GULP1 were detected with anti-LC3 14600-1-AP, a mouse anti-FLAG antibody and an anti-GULP1 G-R3 respectively. α-tubulin was detected with anti-tubulin DM1A and used as a loading control. Bar chart shows the densitometric quantification of relative LC3-II levels against loading control α-tubulin. **p < 0.01, ***p < 0.001. H Quantification of GFP-LC3 puncta plotted by different transfection and treatment as indicated. Data was obtained from at least 40 cells per transfection, and the experiment was repeated three times. Error bars are sem. *p < 0.05, **p < 0.01, ***p < 0.001. I Representative immunoblots for free GFP in control- and GULP1-KD HEK293 cells transfected with GFP-LC3 together with mock or GULP1, and treated as indicated. GFP fusion proteins, ATG14 and GULP1 were detected with anti-GFP JL-8, a rabbit anti-ATG14 antibody and anti-GULP1 G-R3 respectively. α-tubulin was detected with anti-tubulin DM1A and used as a loading control. Bar chart shows densitometric quantification of relative GFP levels against α-tubulin. **p < 0.01, ***p < 0.001. J Representative immunoblots for LC3 from HEK293 cells transfected with control or ATG14 siRNA together with EV, GULP1 or GULP1m. LC3, ATG14 and GULP1 were detected with anti-LC3 14600-1-AP, a rabbit anti-ATG14 antibody and an anti-GULP1 G-R3 respectively. α-tubulin was detected with anti-tubulin DM1A and used as a loading control. Bar chart shows the densitometric quantification of relative LC3-II levels against loading control α-tubulin. **p < 0.01, ***p < 0.001. K Quantification of GFP-LC3 puncta plotted by different transfection and treatment as indicated. Data was obtained from at least 40 cells per transfection, and the experiment was repeated three times. Error bars are sem. *p < 0.05, **p < 0.01, ***p < 0.001

