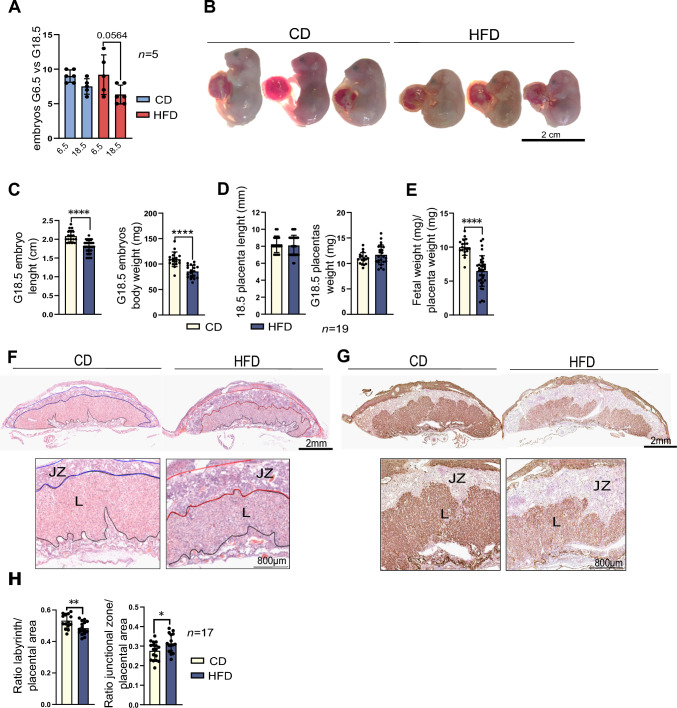
Fig. 5.
Maternal obesity affects fetal-placental growth at embryonic day (E) 18.5. A Number of implantation sites at E6.5 and E18.5 pregnancies in chow-diet (CD) and high-fat diet (HFD) mice. B Representative images of fetuses at E18.5 collected from CD and HFD mice. C Analysis of fetal length and weight at E18.5 and D placental length and weight at E18.5 collected from CD and HFD mice, n indicates number of fetuses or placentas per diet. E Placental efficiency is measured by the fetal-weight-to-placental weight ratio index (FPI). F Haematoxylin and eosin (H&E) of midsagittal sections of E18.5 placentas from CD and HFD mice—labyrinthine zone (LZ) and junctional zone (JZ). G Isolectin BSI-B4 immunohistochemistry of fetal vasculature in the placental labyrinth at E18.5 in placentas collected from CD and HFD mice. H Ratio labyrinth and junctional zone to the placental area at E18.5 in placentas collected from CD and HFD mice, n indicates number of placental sections from 3 to 4 placentas per mother/diet, n = 3 CD and n = 4 HFD. All data are mean ± SEM with individual values from placental sections. Statistical analysis between groups was carried out using Mann–Whitney. *p < 0.05; **p < 0.01; ***p < 0.001

