Fig. 5.
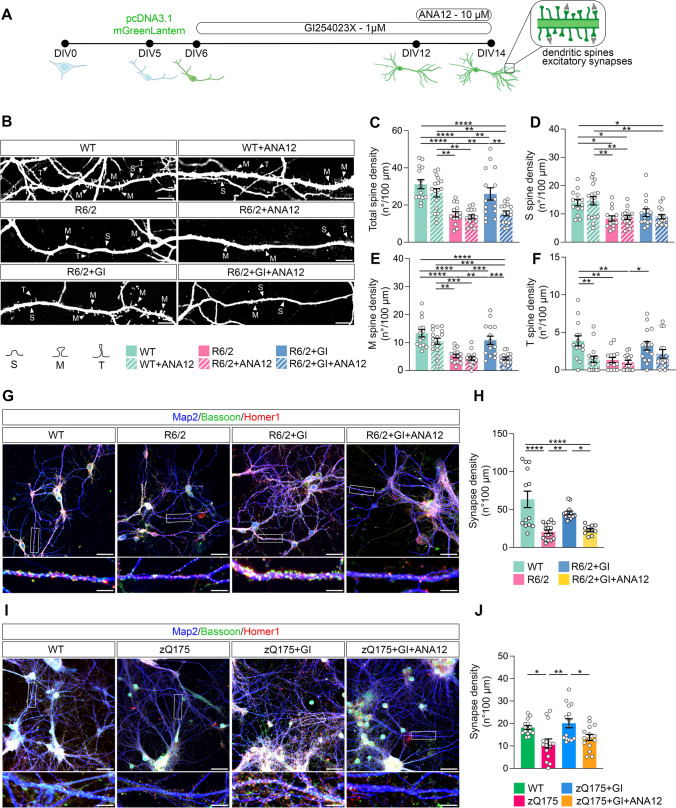
TrkB mediates the neuroprotective effect determined by ADAM10 inhibition on long-lasting spine loss in HD hippocampal neurons. A Hippocampal neurons from WT and R6/2 mice were transfected at DIV5 with pcDNA3.1-mGreenLantern plasmid. The ADAM10 inhibitor GI254023X (GI, 1 µM) was administered from DIV6 until DIV14. The TrkB antagonist ANA12 (10 µM) was administered at DIV12 and cells were fixed at DIV14 for spine analyses and excitatory synapses quantification. B Immunofluorescence images of dendritic spines in hippocampal cultures: WT, WT + ANA12, R6/2, R6/2 + ANA12, R6/2 + GI; R6/2 + GI + ANA12. Scale bars: 10 µm. M, mushroom spines; T, thin spines; S, stubby spines. C-F Density of total, stubby, mushroom, and thin spines. Data are from n = 3 independent primary culture preparations. Each dot in the graphs represents the number of spines in a 100-µm-long dendrite. Data are presented as mean ± SEM. *P < 0.05, **P < 0.01, ***P < 0.001, ****P < 0.0001, One-way ANOVA with Tukey’s post hoc test. G Immunofluorescence images of excitatory synapses in hippocampal cultures: WT, R6/2, R6/2 + GI; R6/2 + GI + ANA12. I Immunofluorescence images of excitatory synapses in hippocampal cultures: WT, zQ175, zQ175 + GI; zQ175 + GI + ANA12. Excitatory synapses in G and I were visualized by Bassoon/Homer1 immunostaining. Map2, pan neuronal marker. Upper panel scale bars: 50 μm; bottom panel scale bars: 10 μm. H, J Synapses quantification. Data are from n = 3 independent primary culture preparations. Each dot in the graphs represents the number of excitatory synapses in a 100-µm-long dendrite. Data are presented as mean ± SEM. *P < 0.05, **P < 0.01, ****P < 0.0001, One-way ANOVA with Tukey’s post-hoc test

