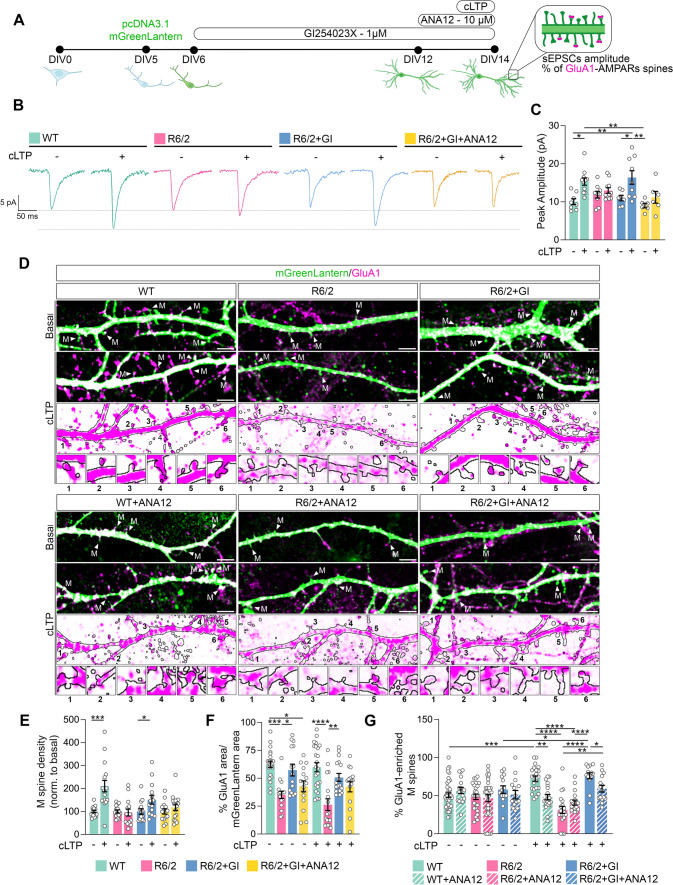
Fig. 6.
Blocking active ADAM10 with GI254023X promotes LTP induction through the TrkB signaling pathway. A Experimental scheme of treatment of WT and R6/2 primary hippocampal neurons. The ADAM10 inhibitor GI254023X (GI, 1 µM) was administered from DIV6 until DIV14. The TrkB antagonist ANA12 (10 µM) was administered at DIV12 until DIV14. Chemical LTP was induced at DIV14 with 0.2 mM glycine for 15 min. For dendritic spine analyses hippocampal neurons were transfected at DIV5 with pcDNA3.1-mGreenLantern plasmid. B Representative traces of spontaneous EPSCs (sEPSCs) recorded at a holding potential of -70 mV in baseline condition and following chemical LTP-induction (cLTP) in primary hippocampal cell cultures obtained from WT and R6/2 mice. + GI and + ANA12 indicate the presence of these substances in culture medium and during electrophysiological recordings. C Graph comparing the amplitudes of sEPSCs in baseline condition and after cLTP induction in the different experimental conditions. Each dot corresponds to the value obtained from a single cell. Data are expressed as mean ± SEM and were analyzed by Two-way ANOVA with Bonferroni’s post hoc test. *P < 0.05, **P < 0.01. D Representative images of dendritic segments (mGreenLantern signal) and GluA1 immunostaining in basal condition and after cLTP induction. M, mushroom spines. Image crops of representative M spines were numbered from 1 to 6. Scale bars: 10 µm. E Quantification of mushroom spine density. Data are from n = 3 independent primary culture preparations. Each dot in the graph represents the number of mushroom spines in a 100-µm-long dendrite. Data are shown as % over the basal condition, which was set to 100, and are expressed as mean ± SEM. *P < 0.05, ***P < 0.001, unpaired t test. F Quantification of GluA1 signal. Data are from n = 3 independent primary culture preparations. Each dot in the graph represents GluA1 signal in a 100-µm-long dendrite. Data are expressed as mean ± SEM and were analyzed by Two-way ANOVA with Tukey’s post hoc test. P* < 0.05, **P < 0.01, ***P < 0.001, ****P < 0.0001. G Percentage of mushroom spines enriched in GluA1 in basal condition and after cLTP induction. Data are from n = 3–5 independent primary culture preparations. Each dot in the graph represents the number of mushroom spines in a 100-µm-long dendrite. Data are expressed as mean ± SEM and statistical analysis was performed by using Two-way ANOVA with Tukey’s post hoc test. P* < 0.05, **P < 0.01, ***P < 0.001, ****P < 0.0001. Supplementary Table 1 and 2: detailed statistical outputs related to panel F and G

