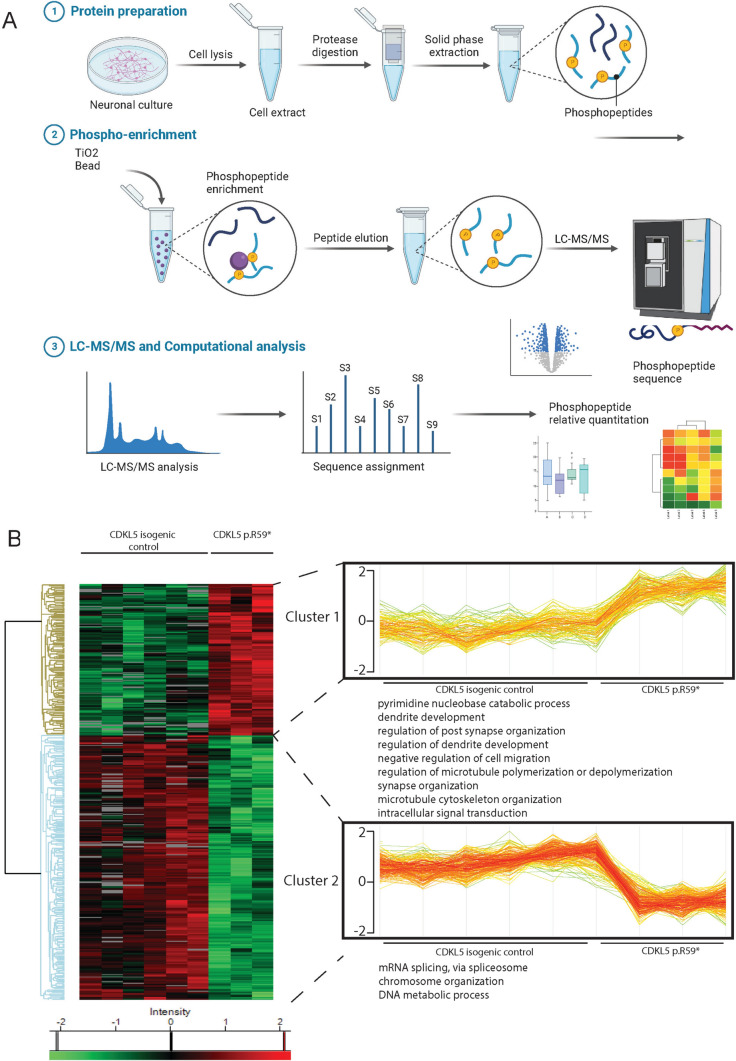
Fig. 1.
Phosphoproteomic workflow and analysis in CDKL5 human neurons. A Workflow for phosphoproteomic analysis in neurons. Neurons from CDKL5 p.(Arg59*) and CDKL5 isogenic controls were cultured in parallel for phosphoproteomic analysis. Neurons were lysed and protein extracts were subject to trypsin digest, peptides were extracted and phosphopeptides were enriched from each sample using TiO2 chromatography. Peptides were separated on a nano-HPLC and analysed by quantitative MS on an Orbitrap Mass Spectrometer. Data was analysed with MaxQuant software and visualised in Perseus software.
Source data for the Fig. is available in Supplemental Materials and online. B Hierarchical heatmap clustering (z-score normalized) of significantly changed proteins from two-sided students T-test (BH FDR < 0.05, S0 = 0.1; n = 6 CDKL5 isogenic control neurons, n = 3 CDKL5 p.(Arg59*) neurons) between the CDKL5 p.(Arg59*) and CDKL5 isogenic control showing phosphosites identified by phosphoproteomic analysis. Horizontal tree indicates 9 independent samples. Vertical tree indicates the 454 significant phosphosites identified. Phosphorylation proteins were separated into two clusters, and each cluster was interrogated by Gene Ontology (GO) analysis. Two of the proteins clusters showing shared GO clusters were bracketed and individual samples were plotted as profile plots of log2-transformed normalized intensities for phosphoproteins in CDKL5 p.(Arg59*) and CDKL5 isogenic controls

