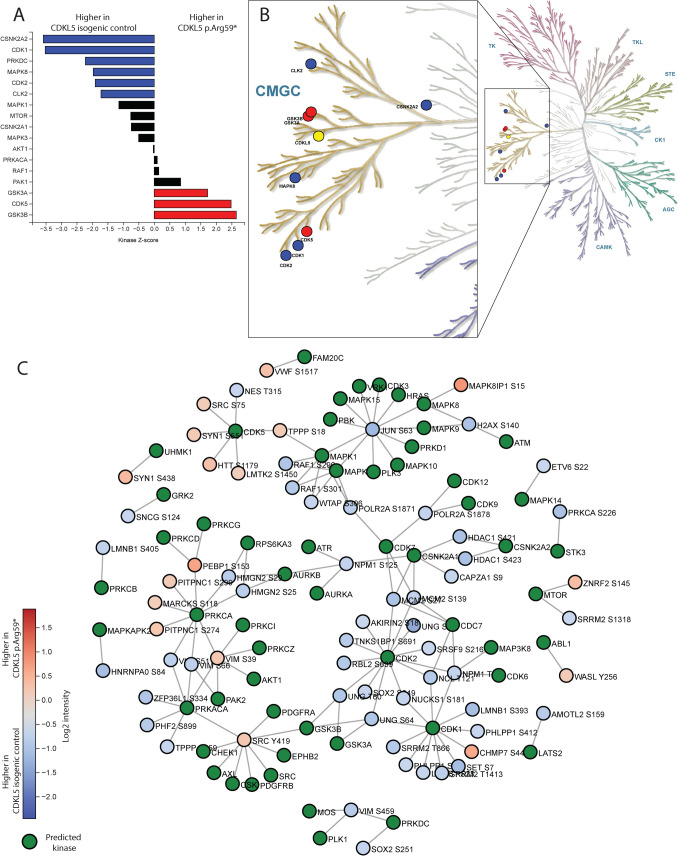
Fig. 3.
Kinome profiling and kinase-substrate interaction in CDKL5 neurons. Phosphoproteomic data was analysed in Phosphomatic.com to determine disrupted kinase activity in CDKL5 neurons. A KSEA analysis provides information on signalling cascades that are altered in CDD subsequent to pathogenic variants in CDKL5. KSEA analysis identifies kinases that are associated with phosphorylation sites in a data set that substantially differ in abundance between two treatment groups. The KSEA Z-score assesses the statistical significance of inferred activities, by normalizing the total log-fold change of substrates with the standard deviation of the log-fold changes of all sites in the dataset. Blue bars represent enrichment of the phospho-sites in CDKL5 isogenic control neurons (Z-scores less than 0) and red bars represent enrichment of the phospho-sites in CDKL5 p.(Arg59*) neurons (Z-score greater than 0). B Kinases from KSEA were mapped onto the human kinase map and circles represent enrichment of kinases that phosphorylate phospho-sites from KSEA analysis. Blue circles are higher in CDKL5 isogenic control neurons and red circles are higher in CDKL5 p.(Arg59*) neurons. CDKL5 is indicated in yellow. C The phosphoproteomic network displays specific relationships between the substrates in CDKL5 isogenic controls compared to CDKL5 p.(Arg59*) neurons and known upstream kinases based on data from PhosphoSitePlus and Signor. Network diagrams represent substrates of the active data group as coloured circles (blue is higher in CDKL5 isogenic control and red is higher in CDKL5 p.(Arg59*) neurons) and known upstream kinases as green circles. Colour-coding of substrates represents mean fold-change between the two groups

