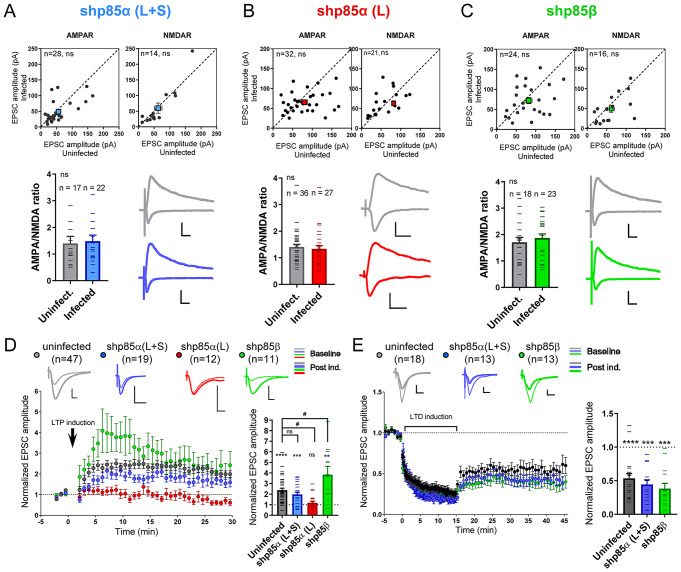
Fig. 1.
Effect of p85 shRNAs on synaptic function and plasticity. A-C. Whole-cell voltage-clamp recordings of CA3-to-CA1 synaptic responses mediated by AMPARs (upper left panels) or NMDARs (upper right panels) from uninfected neurons (control) or from neighboring neurons infected with lentiviral vectors for the expression of shp85α (L + S) (A), shp85α (L) (B) or shp85β (C). EPSC amplitudes for each pair of cells are represented as black circles in the scatter plots. Average responses are indicated with colored squares (mean ± SEM). The ratio of AMPAR to NMDAR responses is also plotted from individual cells (lower left panels). Representative traces from uninfected and infected neurons are shown in the lower right panels. Scale bars represent 50 pA (Y axis), 20 ms (X axis). Statistical differences between conditions were assessed by Wilcoxon t-test (paired recordings) or by Mann-Whitney test (AMPA/NMDA ratios). n: number of cells. ns: not significant. D, E. Left, time course of the normalized AMPAR-mediated responses (mean ± SEM) during a baseline period and after induction of NMDAR-dependent LTP (D) or mGluR-dependent LTD (E). EPSC amplitude is normalized to the average baseline. Right, histogram showing EPSC amplitude for each cell collected from the first 5–10 min of the recording after induction of NMDAR-dependent LTP (D) or the last 5 min of the recording after induction of mGluR-dependent LTD (E), normalized to their average baseline. Individual values for each experiment are represented as lines overlying the columns. Bars show mean ± SEM. Significant potentiation or depression was assessed via Wilcoxon t-test. ****p < 0.0001, ***p < 0.001, **p < 0.01. Significant differences between conditions were evaluated by one-way ANOVA test followed by the Tukey’s multiple comparisons test. #p < = 0.05. n: number of cells. ns: not significant. Representative traces are shown above the time courses for baseline (thin lines) and post-induction (thick lines). Scale bars represent 50 pA (Y axis), 10 ms (X axis)

