Fig. 3.
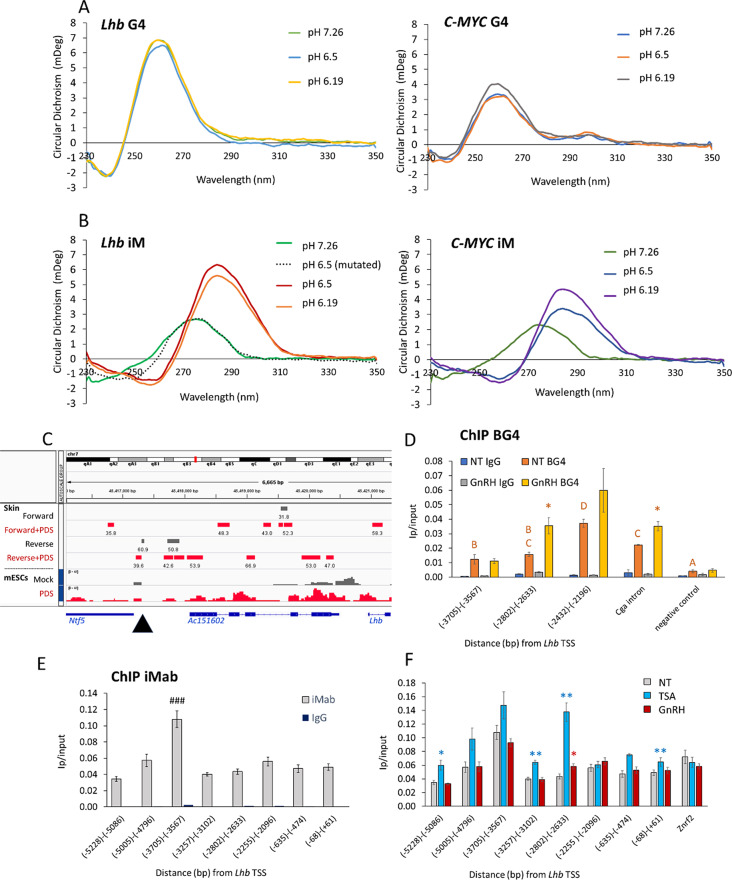
The central region of the Lhb enhancer forms a stable iM structure in gonadotropes. Circular dichroism was performed with ssDNA from the central untranscribed region of the Lhb enhancer and previously reported human c-MYC or mutated sequences as controls. (A) The G-rich sequence spectra are characteristic of the G4, regardless of pH, and (B) the complementary C-rich sequence spectra characteristic of the iM only at the lower pHs (see also Fig S4). (C) IGV view of the locus showing published data from BG4 ChIP-seq or CUT&RUN experiments in mouse skin [52] and mESCs [38] respectively, with or without PDS treatment; site of the G/C rich sequence at the central untranscribed region of the enhancer is marked with an arrowhead. (D) BG4 ChIP at the enhancer, lncRNA promoter and 5’ end in LβT2 cells, with or without GnRH treatment (2 h, 100 nM). Levels (mean ± SEM, n = 3) are shown as IP/input; ANOVA followed by Bonferroni t-test compared all levels in non-treated cells, and those sharing the same letter are not significantly different (P > 0.05); asterisks mark significantly higher levels following GnRH treatment. The GnRH-responsive gene, Cga, is positive control. (E, F) ChIP for iM in LβT2 cells using iMab antibody. Levels (mean ± SEM, n = 3) are shown as IP/input; ###: P < 0.0001 compared to all other groups in ANOVA followed by Tukey HSD. (F) As part of the same experiment (controls are as in E), some of the cells were treated with GnRH (2 h, 100 nM) or TSA (24 h, 100 ng/ml). Student’s t-test compared levels in each treatment group with those in untreated cells at the same region, *: P < 0.05; **: P < 0.01

