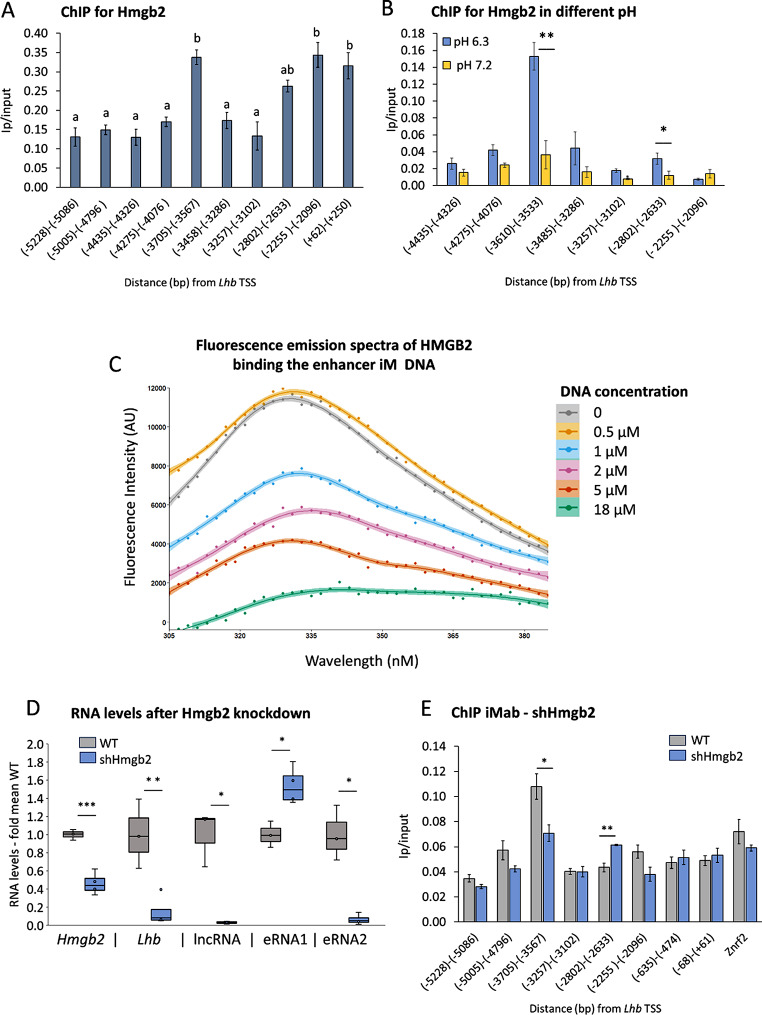
Fig. 4.
Hmgb2 binding the enhancer iM directs transcription specifically to eRNA2. (A, B) ChIP for Hmgb2 was carried out in LβT2 cells. In (A) cells were cultured in standard media; and IP/input levels presented as mean±SEM, n = 3; ANOVA followed by Bonferroni t-test compared all means, and those that are similar (P>0.05) share the same letter. In (B) the cells were treated for 2.5 h with phosphate buffer at pH 7.2 or pH 6.3; t-test compared means at each locus in the different conditions, and annotations are as before; n = 4. (C) Fluorescence emission spectra of HMGB2 (1 µM) at 280 nm in the presence of Lhb enhancer iM DNA (0-18 µM; see also Fig S6, S7). (D,E) Hmgb2 was knocked down with shRNA, and (D) Hmgb2 and Lhb mRNA, lncRNA and eRNA levels measured in these (n = 4) and control WT cells (n = 3); whiskers show minimum and maximum values relative to mean levels in WT control cells, boxes 25–75% ranges, and internal horizontal lines indicate median; Student’s t-test compared values with those in WT controls, annotated as before; ***: P < 0.001 (E) IMab ChIP was carried out in these Hmgb2 KD cells (part of the same experiment as shown in Fig 3E), and data presented as before, with Znrf2 as control; n = 3

