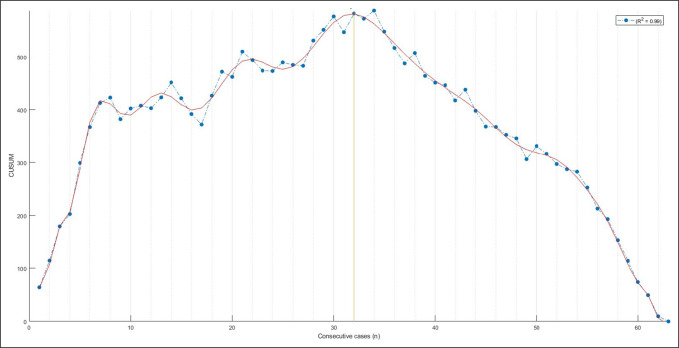
Figure 1.
Line graph demonstrating the development of the learning and mastery phase based on cumulative summation analysis versus case number. The yellow line is at 32 cases. The initial portion of the curve to the left of the yellow line represents the learning phase; the portion of the curve to the right of the yellow line represents the approach of individual surgical time to the average surgical time and can be interpreted as the mastery phase.

