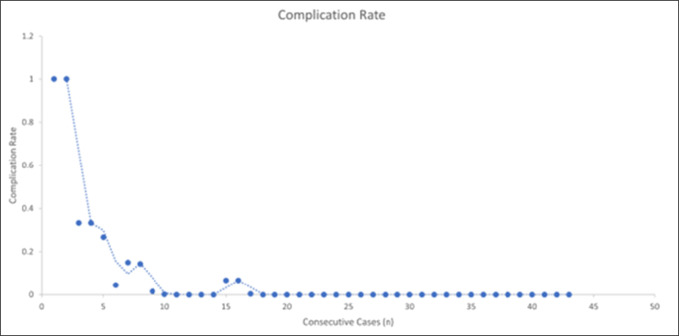
Figure 3.
Forest plot showing the cumulative complication rate—calculated as the number of complications over the total number of cases performed—plotted against consecutive case numbers. This shows an overall low complication rate, with all complications occurring within the learning phase and asymptotically approaching zero as the case number increases.

