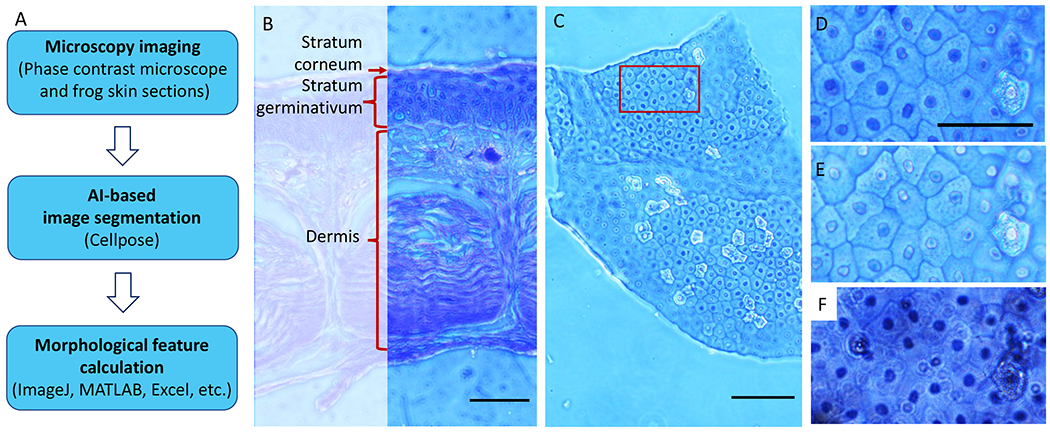
Fig 2.

Data acquisition and analysis overview. (A) Workflow describing the 3 key experimental steps. Phase contrast images of frog skin epithelial cells are acquired (top) and used as an input into Cellpose, which is an AI-based segmentation tool for nuclear and cytoplasmic segmentation (middle). The segmentation outlines exported from Cellpose were then read into ImageJ to obtain morphologic measurements for downstream analyses, which can be performed by using various platforms, including MATLAB or Excel (bottom). (B) Cross-section image of frog skin illustrating the 3 main layers of the tissue. In this work, we focused on the topmost layer of the skin, the stratum corneum, because it can be approximated as a 2D system. Scale bar = 200 μm. (C) The 10× phase contrast image of flat-mount frog skin, illustrating the overall shape and dimension of the sample. Out-of-focus regions represent portions of the sample that are not in the same optical plane due to sample wrinkling. The red box denotes the region of interest (ROI) shown in (D–F). Scale bar = 100 ¼m. (D) The 20× phase contrast image of ROI shown in (C). (E) The 40× phase contrast image of the same ROI. (F) The 40× bright field image of the same ROI, but this produced a more out-of-focus background and less defined boundaries, which may reduce the segmentation robustness. Scale bars in (D–F) = 50 ¼m.
