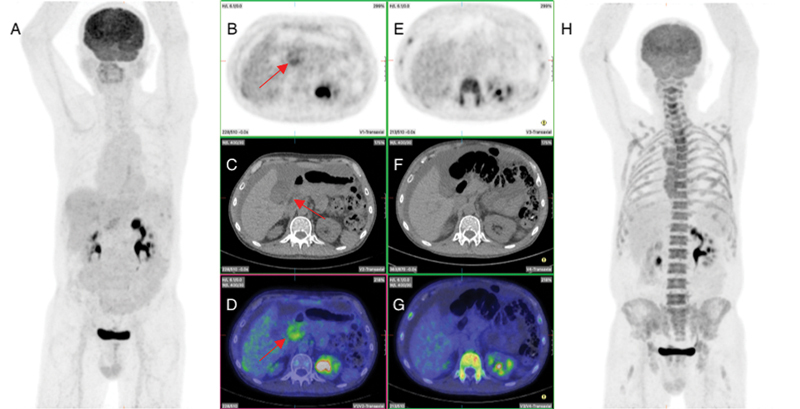
Fig. 4.

Pre- and post-treatment fluorodeoxyglucose positron emission tomography (PET) after second peritoneal recurrence showing complete metabolic response of peritoneal recurrence in the mid abdomen. ( A ) Pre-therapy maximum intensity projection (MIP) image showing recurrence in the mid abdomen. ( B – D ) Pre-therapy transverse section of PET, computed tomography (CT), and fused images, respectively, showing peritoneal recurrence in the mid abdomen and ascites ( red arrow ). ( E – G ) Post-therapy transverse section of PET, CT, and fused images, respectively, showing complete metabolic resolution of mid abdomen peritoneal disease but persistent ascites. ( H ) Post-therapy MIP image showing complete metabolic response of the peritoneal recurrence.
