
Fig. 2.
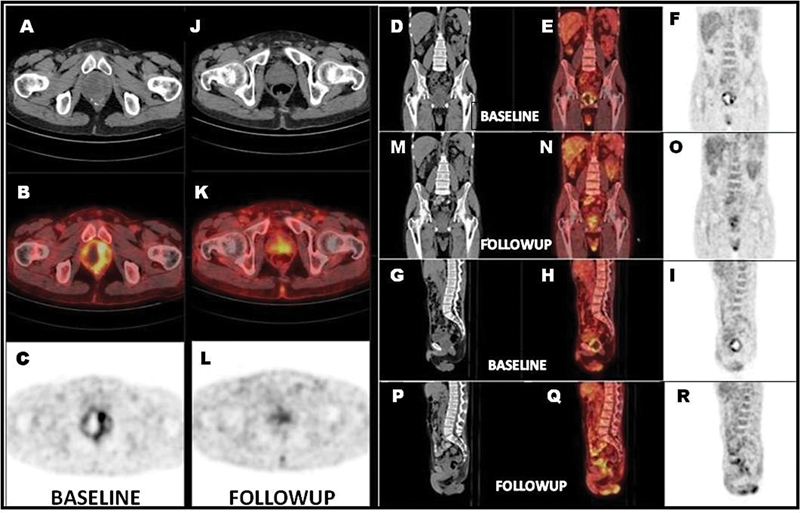
18F-fluorodeoxyglucose positron emission tomography (18F-FDG PET) whole-body maximal intensity projection images. Anterior (A, C) and left lateral (B,D) and baseline (A,B) images showing abnormal heterogenous tracer uptake in enlarged prostate (maximum standardized uptake value - 6.85) with relative cold areas within metabolically active lesions (black thick arrow), focal tracer uptake (SUVmax: 4.75; white dotted arrow) in upper pole of transplant kidney in right iliac fossa; Follow-up (C, D) showing no new lesion, residual low-grade tracer uptake in the prostate (SUVmax: 3.57; black thick arrow), transplant renal cortex unremarkable.