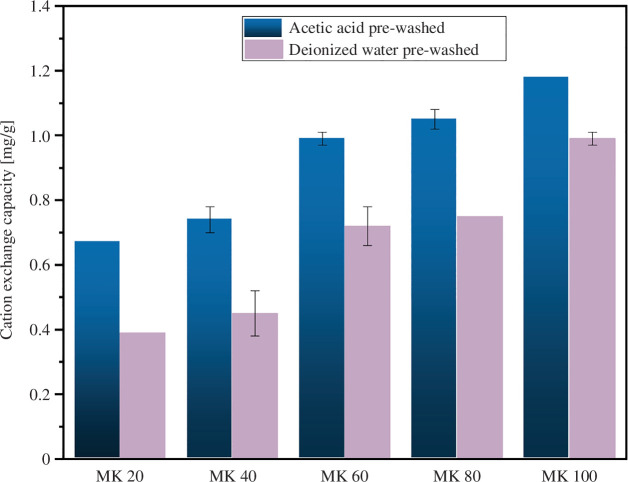
Figure 6.
Comparative cation exchange amount of the granules under the experimental conditions (pH of ~7, granule dosing 2 g per 40 ml, initial NH4+ concentration of 50 mg L−1 and mixing time of 24 h at 21°C). The results are shown as an average (n = 2) and the error bars represent the difference between the measurements.

