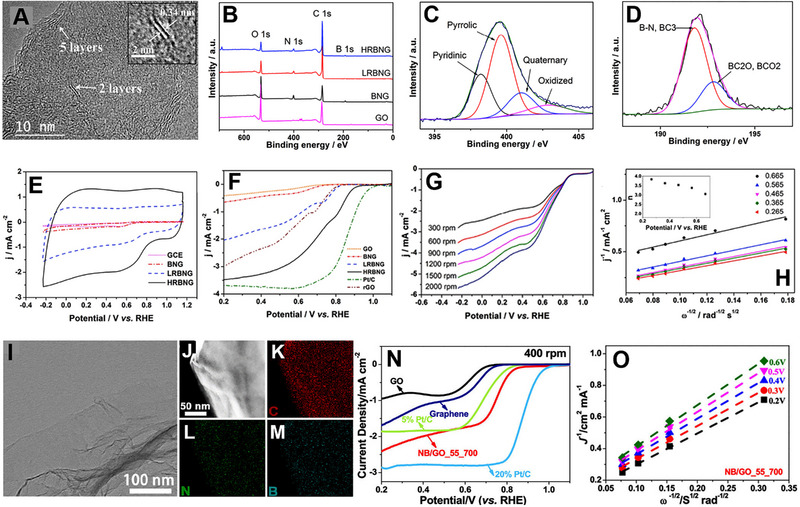
FIGURE 6.

(A) HRTEM image of HRBNG. (B) XPS survey spectra of GO, BNG, LRBNG, and HRBNG. XPS region spectra of (C) N1s and (D) B1s. (E) CVs of GCE, BNG, LRBNG, and RHBNG in O2 saturated 0.1 M KOH solutions at a scan rate of 100 mV‐1. (F) LSV curves of GO, BNG, LRBNG, HRBNG, Pt/C, and rGO in O2 saturated 0.1 m KOH solution at a scan rate of 10 mV s‐1 and electrode rotating rate of 1500 rpm. (G) LSV curves of HRBNG at different rotation speeds. (H) K–L plot for the HRBNG at different potentials. Reproduced with permission.[ 115 ] Copyright 2016, Elsevier. (I) TEM and (J) STEM images of NB/GO_55_700 with corresponding EDX mapping of (K) C, (L) N, and (M) B. (N) LSV curves of graphene, GO, NB/GO_55_700, 5% Pt/C, and 20% Pt/C in O2 saturated 0.1 m KOH solution at a scan rate of 5 mV s‐1 and electrode rotating rate of 400 rpm. (O) K–L plots of NB/GO_55_700 derived from LSVs recorded at different rotation speeds. Reproduced with permission.[ 116 ] Copyright 2019, American Chemical Society.
