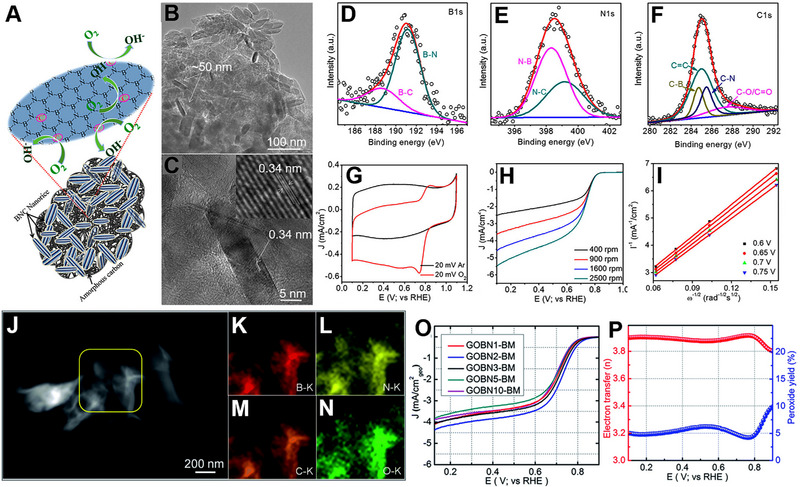
FIGURE 11.

(A) Schematic illustration for ORR of carbon‐doped h‐BN (BNC) catalyst. (B) TEM and (C) HRTEM images of BNC catalyst. Deconvoluted XPS spectra of (D) B1s, (E) N1s, and (F) C1s. (G) CVs of BNC catalyst, recorded in Ar‐ and O2‐saturated 0.1 m KOH at a scan rate of 20 mV s‐1. (H) ORR polarization curves of BNC catalyst under O2‐saturated 0.1 m KOH recorded at various rotation speeds (I) K‐L plot of BNC catalyst at different potentials. Reproduced with permission.[ 167 ] Copyright 2018, American Chemical Society. (J) HAADF‐STEM image of the GOBN2–BM catalyst and (K–N) corresponding elemental mapping of B, N, C, and O. (O) Comparison of the ORR LSV curves of electrocatalysts with varied h‐BN amount in O2‐saturated 0.1 m KOH at 1600 rpm with a scan rate of 10 mV s‐1. (P) Extent of peroxide yield and number of electrons transferred (n) of the GOBN2–BM catalyst in the potential range of 0.1 to 0.9 V versus RHE. Reproduced with permission.[ 169 ] Copyright 2018, Royal Society of Chemistry.
