
FIGURE 13.
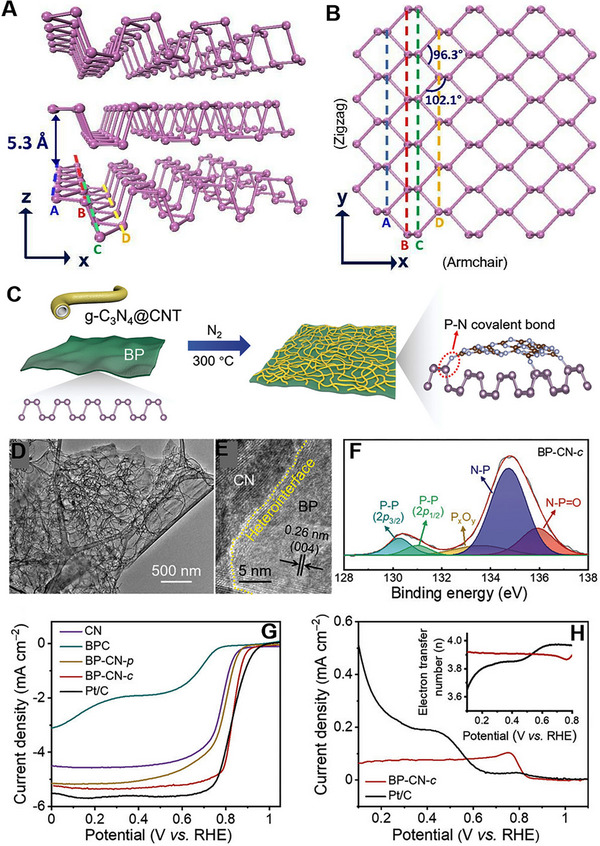
Crystal structure of BP (A) side view and (B) top view. Reproduced with permission.[ 186 ] Copyright 2015, National Academy of Sciences. (C) Schematic representation of BP‐CN‐c synthesis. (D, E) TEM and HRETM images of BP‐CN‐c (F) P 2p region XPS spectrum (G) ORR polarization curves of CN, BPC, BP‐CN‐p, BP‐CN‐c, and Pt/C at 5 mV s‐1 with a rotating speed of 1600 rpm. (H) Ring current densities and the calculated electron transfer numbers (inset) for BP‐CN‐c and Pt/C. Reproduced with permission.[ 189 ] Copyright 2021, Wiley‐VCH.