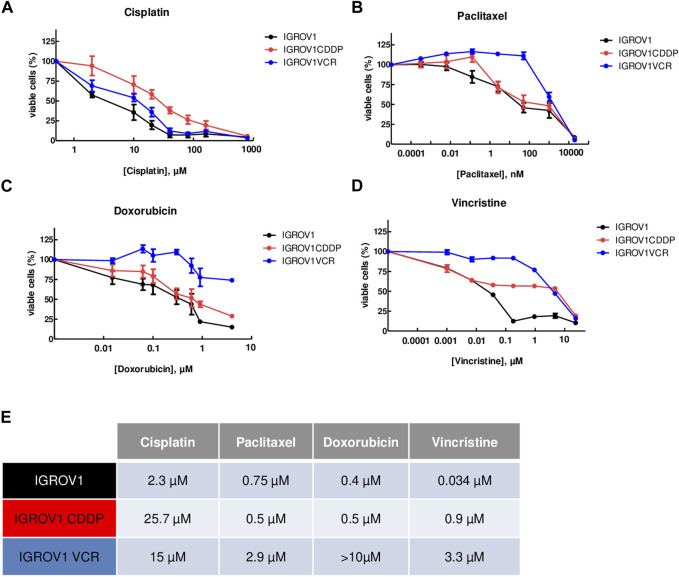
FIGURE 1.
OA cell lines used are resistant to different chemotherapies. (A–D) Calculation of IC50 values using the MTT assay upon treatment with cisplatin (A), paclitaxel (B), doxorubicin (C), or vincristine (D) for 72 h. IGROV1 survival percentages are represented by black dots connected by a black line, IGROV1CDDP is represented in red, and IGROV1VCR is represented in blue. All experiments have been performed on three to six independent biological replicates. For each point, the mean ± SEM is represented. (E) IC50 values obtained in the different models and with the indicated conditions. The table shows the values obtained in IGROV1, IGROV1CDDP, and IGROV1VCR with cisplatin, paclitaxel, doxorubicin, or vincristine.

