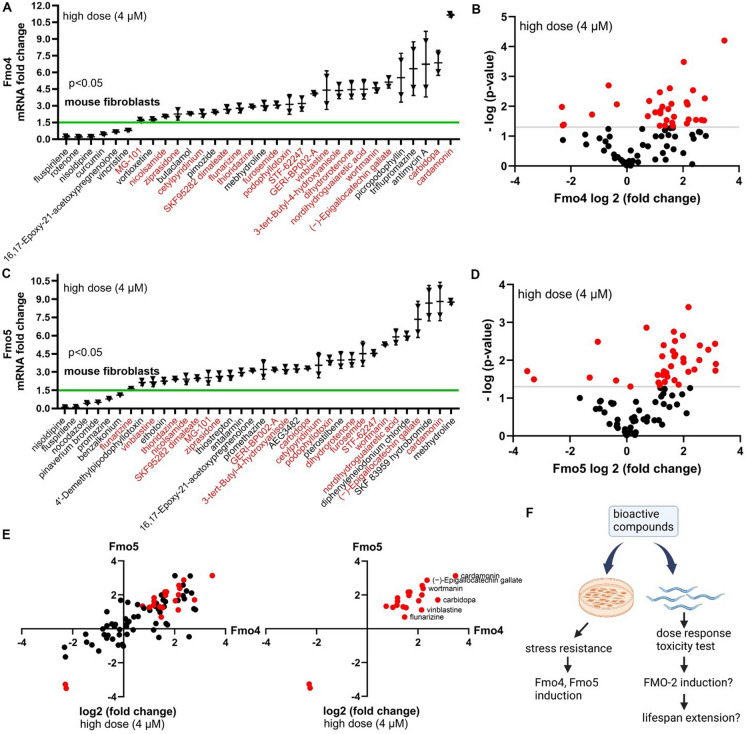
Fig. 1.
Drugs that increase stress resistance in mouse fibroblasts also increase Fmo4 and Fmo5 transcript levels. A–D Changes in expression of Fmo4 and Fmo5 mRNA in mouse fibroblasts from UM-HET3 mice treated with 4 μM of the indicated drugs compared to DMSO control. Fmo4 or Fmo5 mRNA levels were measured by qRT-PCR. Horizontal lines represent the mean, and error bars represent SD. Drugs that increase both Fmo4 and Fmo5 mRNA levels are shown in red in A and C. The x-axis values, shown on a log2 scale in B and D, represent the change of mRNA levels. The y-axis values, shown on a − log10 scale in B and D, represent the P-values. Drugs that affect the mRNA levels of Fmo4 or Fmo5 significantly are shown in red in B and D. E Drugs that co-regulate mRNA levels of Fmo4 and Fmo5 are shown by a scatter plot on a log2 scale fold change. Drugs that significantly increase both Fmo4 and Fmo5 mRNA levels are shown in red in the second quadrant. F Diagram showing that bioactive compounds increase stress resistance and induce Fmo4 and Fmo5 levels in mouse fibroblasts and will be tested for fmo-2 induction and lifespan extension in C. elegans. All drugs shown have P < 0.05 when compared to control (Welch two-sample t-test, two-sided)

