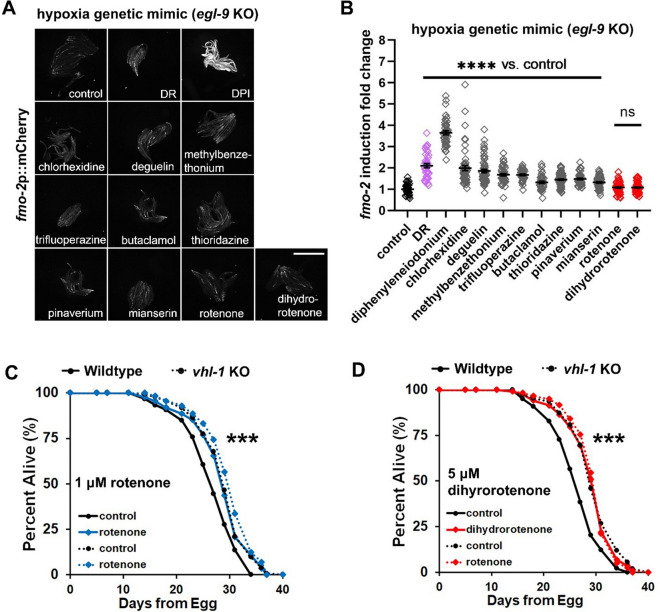
Fig. 5.
Mitochondrial complex I inhibitors induce fmo-2 and extend lifespan within the hypoxia pathway. A–B Images and quantification of fmo-2p::mCherry by strong drug hits in the egl-9 mutant background. Red denotes drugs that do not further induce fmo-2, while gray denotes significant additional induction of fmo-2 in the egl-9 mutant. Dietary restriction (DR) condition is a positive control that induces fmo-2 (purple). In all experiments, fmo-2p::mCherry;egl-9(sa307) animals were synchronized to L4 stage before treatment with the indicated drugs. Worms were treated with 1-μM rotenone, 100-μM deguelin, 100-μM pinaverium bromide, 100-μM dihydrorotenone, 30-μM chlorhexidine, 100-μM trifluoperazine, 500-μM diphenyleneiodonium (DPI), 500-μM butaclamol, 100-μM methylbenzethonium, 100-μM thioridazine, and 100-μM mianserin as a positive control. Scale bar, 1 mm. C–D Survival curves of vhl-1 knockout strains treated with 1-μM rotenone or 5-μM dihydrorotenone from L4 stage. Rotenone and dihydrorotenone do not significantly extend lifespan of vhl-1(ok161) worms. ****indicates P < 0.0001 when compared to control (Welch two-sample t-test, two-sided) in B. ***indicates P < 0.001 when drug induced lifespan extension of wild-type strain compared to vhl-1 strain (Cox regression) in C and D. P-values (log-rank test) and Cox regression analyses of lifespan statistics are listed in Supplementary Tables 3 and 5

