FIGURE 1.

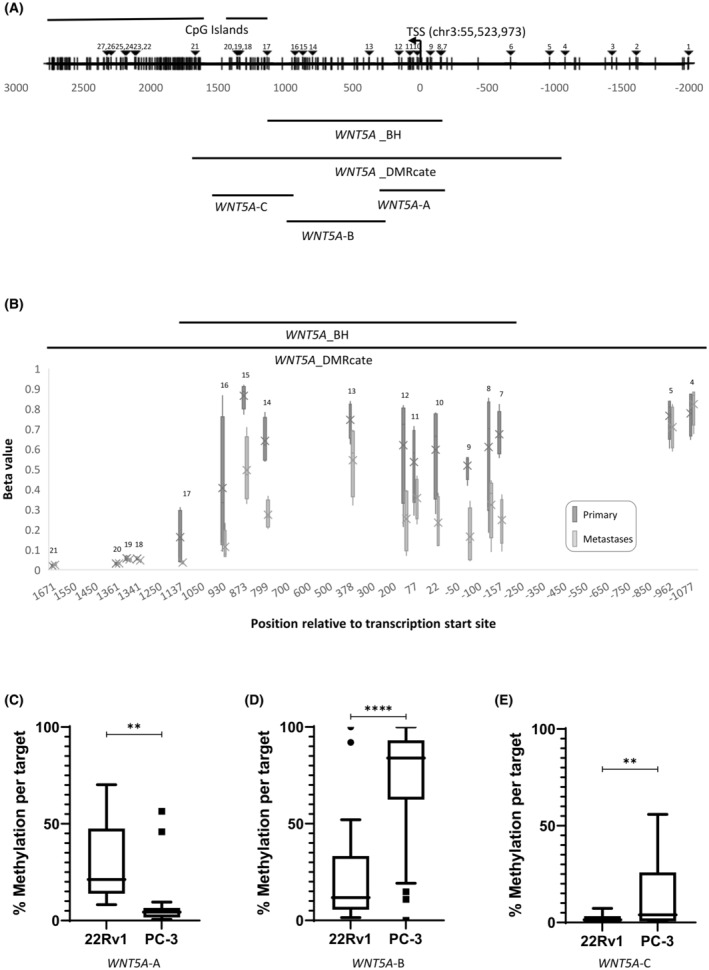
(A) Schematic representation of the promoter region of WNT5A. Transcription start site (TSS) at chr3: 55,523,973 (hg19) and CpG islands are indicated. CpG sites are indicated by vertical lines. CpG sites interrogated by the Illumina Methylation EPIC array are indicated by triangles and labelled 1–27. Region from bumphunter (WNT5A_BH) and DMRcate (WNT5A_DMRcate) analyses are indicated. Region amplified using primer sets WNT5A‐A, WNT5A‐B and WNT5A‐C and analysed by bisulphite sequencing are indicated. (B) WNT5A methylation in paired primary PrCa and metastatic bone samples. Methylation status of the 17 CpG sites within the significantly differentially methylated region found in WNT5A with DMRcate analysis in tumour (dark grey) and paired bone metastases (light grey) as determined using the EPIC array. The significantly differentially methylated region found by bumphunter analysis (11 CpGs) is indicated. CpG numbers correspond to (A). The box plots depict the spread of beta values for each CpG across the four patient samples in each group (primary vs. metastasis). The mean of the group is labelled with a cross. The beta values are taken from many reads of ‘methylated’ or ‘unmethylated’ to generate a percentage methylated (1 being fully methylated, 0 being unmethylated) per sample. CpG site #6 failed quality control. (C–E) Average WNT5A methylation across the region encompassed by primer sets WNT5A‐A (18 CpGs) (C), WNT5A‐B (30 CpGs) (D) and WNT5A‐C (20 CpGs) (E) in prostate cancer cells, 22Rv1 and PC‐3. Statistical significance was determined using a paired t‐test, **p < 0.01, ****p < 0.0001.
