FIGURE 5.

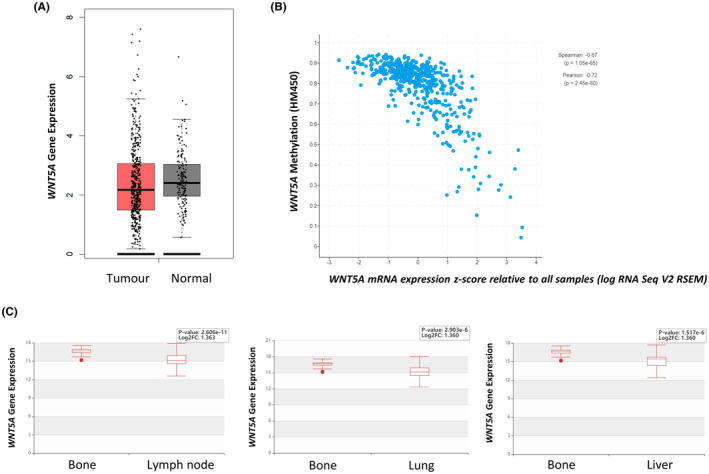
WNT5A expression in publicly available datasets. (A) WNT5A expression in tumour (n = 492; red) versus normal prostate samples (n = 152; grey) from TCGA‐PRAD. (B) Correlation between WNT5A methylation and mRNA expression in primary prostate TCGA‐PRAD tumours, taken from the cBioPortal. 20 WNT5A methylation (β‐value) is plotted on the y‐axis, a higher value indicates higher methylation. WNT5A mRNA expression z‐score is plotted on the x‐axis, a higher value indicates higher expression. (C) WNT5A gene expression in unpaired patient samples of bone (n = 20), lymph node (n = 69), lung (n = 22) and liver (n = 21) metastases. Data and images were taken from the Human Cancer Metastasis Database in 2021 (EXP00337‐9). 21
