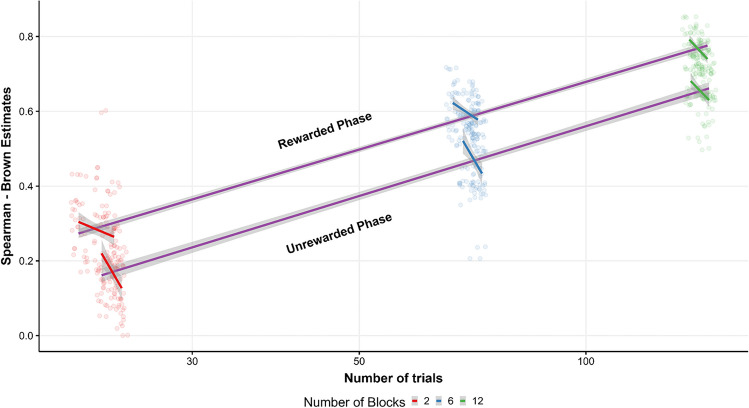
Fig. 7.
Relationship between reliability and number of trials. The general relationship between the overall number of trials (log-scaled for visualization purposes) and reliability is represented by the blue regression line (95% CI), where the upper regression line denotes the rewarded phase and the lower line denotes the unrewarded phase. Color represents a different number of blocks used for reliability calculation, where each colored regression line shows how outlier removal methods influence on reliability across different numbers of blocks

