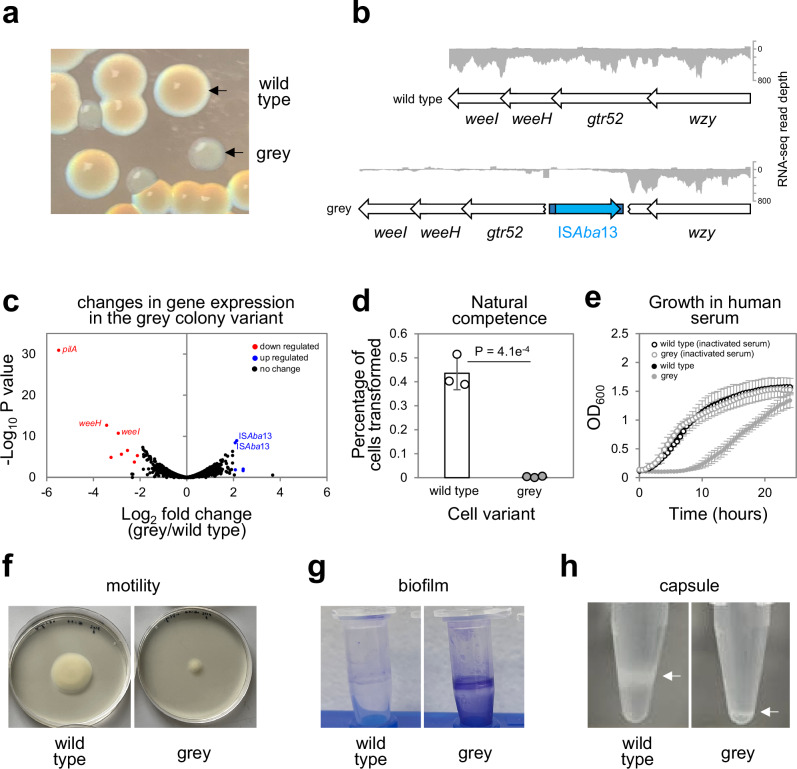
Fig. 1. Phenotypic diversity resulting from ISAba13 transposition into the Acinetobacter baumannii K-locus.
a Identification of a grey colony derivative. The image shows colonies of A. baumannii AB5075 grown on LB agar plates. The grey colony derivative arises spontaneously. b Genetic basis for the grey colony phenotype. Grey colony derivatives have a copy of the insertion sequence ISAba13 within the gtr52 gene of the capsule locus. Genes are shown as arrows and labelled. ISAba13 is in blue. The darker blue sections of ISAba13 represent the terminal inverted repeat sequences. The traces show Illumina sequencing read depths from RNA-seq experiments. Reads mapping to the top and bottom strands of the DNA are shown as positive and negative values respectively. The weeH and weeI genes are also referred to by the pseudonyms itrA1 and qhbA respectively40,94,95. Note that only a section of the K-locus is illustrated, the full region occupies genomic positions 3,907,256 to 3,931,673. c Disruption of the K-locus also causes down regulation of the pilA gene. The volcano plot illustrates the results of RNA-seq experiments comparing the transcriptomes of wild type and grey colony types. Each data point represents a gene and significantly up- and down-regulated genes (P < 0.05 and a Log2 fold change of 2 or more) are highlighted blue and red respectively. P was calculated using an exact test. Notable genes are labelled. Note that the apparent up regulation of ISAba13 is likely to be an artefact due to the increased copy number of the element in grey cell derivatives. Two biological replicates were done. Source data are provided as a Source Data file. d Grey variants are defective for natural transformation. The bar chart shows the percentage of wild type and grey variant cells transformed by exogenous DNA. Results are the average of three biological replicates and error bars indicate standard deviation from the mean. Individual measurements are shown as discrete datapoints. A two-tailed student’s t test was used to determine P. Source data are provided as a Source Data file. e Grey variants cannot grow in human serum. The graph shows growth of wild type A. baumannii and the grey variant in the presence of 50% (v/v) human serum or heat inactivated human serum. Results are the average of three biological replicates and error bars indicate standard deviation from the mean. There is a significant difference in growth for wild type and grey variants in human serum (P = 9.3e−8) but not heat inactivated serum (P = 0.97) as determined using a one-way ANOVA test. Source data are provided as a Source Data file. f Grey colony variants are less motile. The image shows spread of wild type and grey colony variants on soft agar plates. g Grey colony variants better adhere to surfaces and form biofilms. The image shows crystal violet stained A. baumannii biofilms formed on the surface of microfuge tubes. h Grey colony derivatives are defective for capsule production. The images show cells separated by centrifugation in 125 µl of 30% (w/v) colloidal silica. Cells are visible as white bands and those with less capsule are more mobile during centrifugation.

