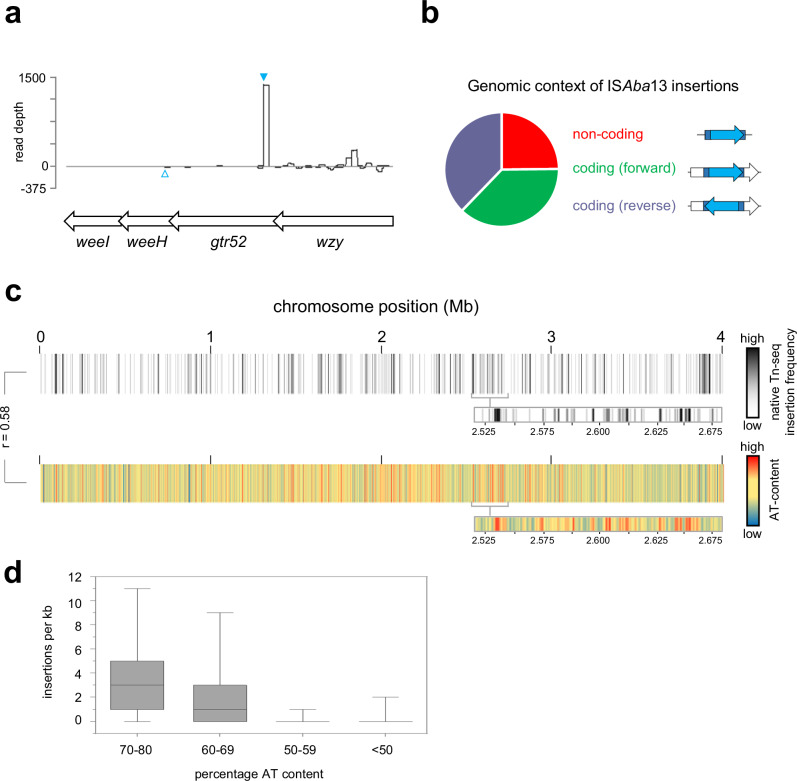
Fig. 2. Mapping genome and population wide transposition of ISAba13 reveals a strong preference for the K-locus and other AT-rich DNA regions.
a ISAba13 insertions at the K-locus. The schematic shows a section of the K-locus and corresponding read depths from native Tn-seq experiments. Genes are shown as arrows and sequence reads corresponding to ISAba13 insertion in the forward or reverse orientation are given as positive or negative read depths respectively. The filled cyan triangle indicates the site of ISAba13 insertion in the grey variant described in this work. The open cyan triangle indicates the site of ISAba13 insertion previously described by Whiteway et al. 48. b Genomic context of ISAba13 insertions. The pie chart illustrates the relative number of ISAba13 insertions detected in non-coding DNA or inside genes in each possible orientation. Note that non-coding DNA accounts for 13% of the A. baumannii chromosome but contains 25% of the ISAba13 insertions. c Chromosome-wide patterns of ISAba13 transposition. The panel shows two heatmaps, each representing the A. baumannii chromosome divided into 1 kb sections. Each section is coloured according to the number of ISAba13 insertions detected using native Tn-seq (top) or average DNA AT-content (bottom). The heatmap expansions are provided to aid comparison of the insertion frequency and AT-content. The Pearson correlation coefficient (r) of the two datasets is shown. d ISAba13 targets AT-rich sections of the A. baumannii chromosome. Box plot showing the distribution of ISAba13 insertion frequencies for 1 kb regions, with different AT-content, across two biological replicates. Boxes indicate the 25th–75th percentile. Horizontal lines indicate the median value. The whiskers indicate minimum and maximum values. Source data are provided as a Source Data file.

