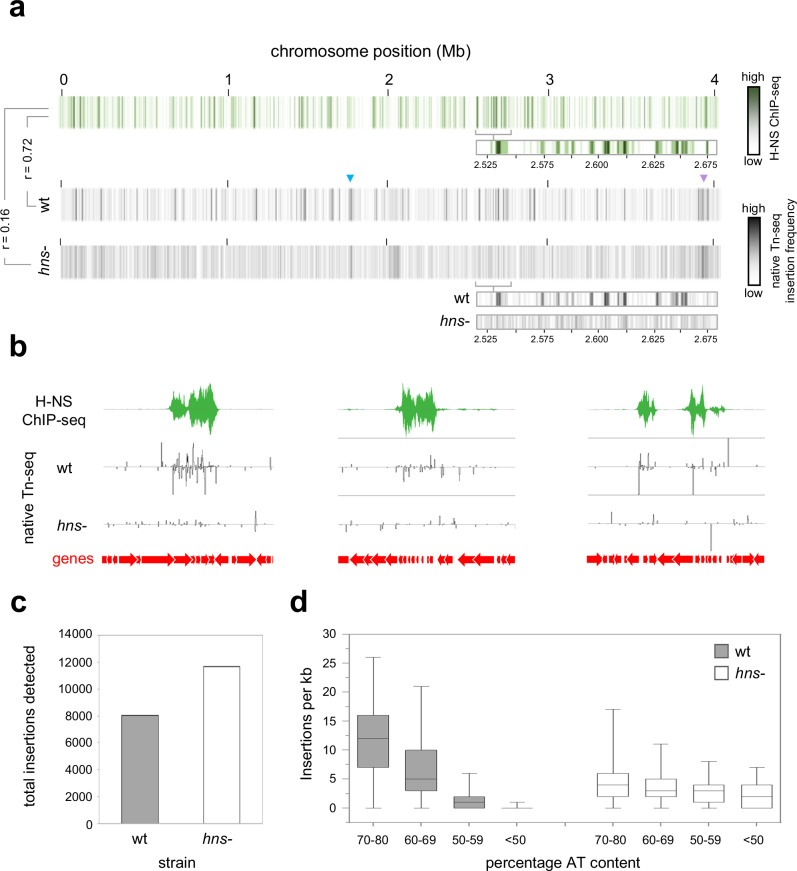
Fig. 3. Targeting of ISAba13 to AT-rich DNA is driven by H-NS.
a Global patterns of H-NS binding and ISAba13 transposition are correlated and H-NS dependent. The panel shows three heatmaps, each representing the A. baumannii chromosome divided into 1 kb sections. Sections are coloured according to the H-NS ChIP-seq binding signal (top) or the number of ISAba13 insertions detected using native Tn-seq for wild type (middle) or hns- cells (bottom). The heatmap expansions are provided to aid comparison of H-NS binding and insertion frequency. Pearson correlation coefficients (r) between datasets are shown. The raw H-NS ChIP-seq read depths are provided in Supplementary Data 1. b Examples of H-NS mediated ISAba13 capture. Selected chromosomal regions with H-NS ChIP-seq and native Tn-seq data shown. In both cases, traces indicate read depths with positive and negative values corresponding to the top and bottom DNA strand respectively. Genes are shown as arrows. From left to right, the genomic loci are centred approximately around positions 134,000, 2,536,000 and 2,455,000 of the genome. c The number of detected transposition events is similar in the presence and absence of H-NS. The bar chart shows the number of ISAba13 insertions detected by native Tn-seq in wild type and hns- cells. For each strain, the number of insertions indicated is the combined total from two biological replicates. Source data are provided as a Source Data file. d Targeting of ISAba13 to AT-rich DNA is H-NS dependent. Box plot showing the distribution of ISAba13 insertion frequencies for 1 kb regions, with different AT-contents, in two biological replicates of wild type and hns- cells. Boxes indicate the 25th–75th percentile. Horizontal lines indicate the median value. The whiskers indicate minimum and maximum values. Source data are provided as a Source Data file.

