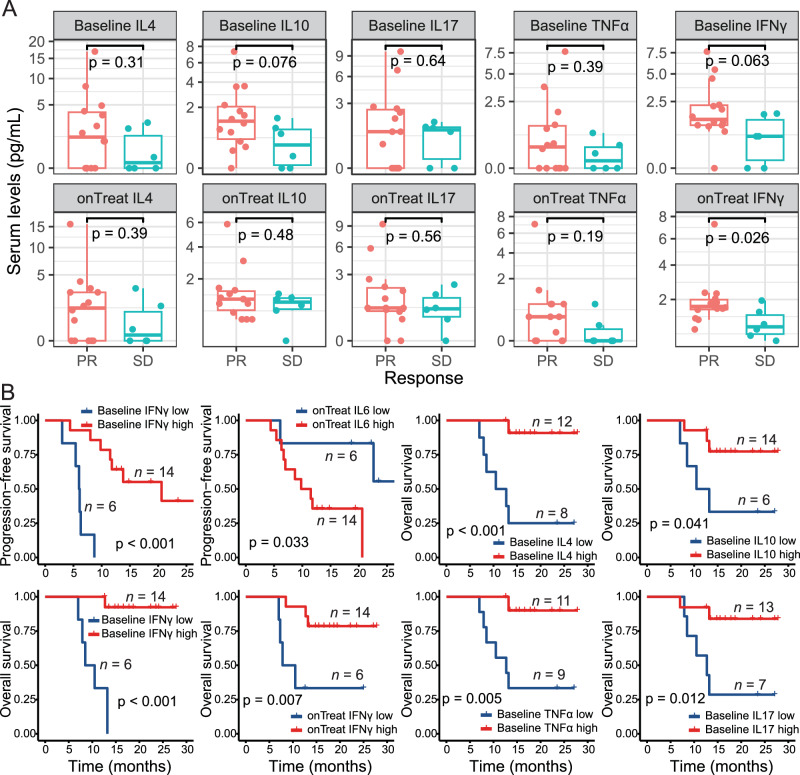
Fig. 5. Peripheral cytokines predict treatment response and patient survival.
A Serum levels of different cytokines at baseline or on-treatment between patients achieving a PR (n = 14 samples) and those achieving SD (n = 6 samples). For box plots, the central line represents the median value, the bottom and top of the box represent the values of the 25th and 75th percentile, and the lower and upper whiskers represent the minimum and maximum value of the data, respectively. The p-values are derived from a two-tailed Mann–Whitney test. B Progression-free and overall survival analyses for different periphery cytokines. Patients were grouped into low- and high-expression of each variable as described in the Methods (n = 20 samples). The p-values are derived from a two-tailed Log-rank test. Exact p-values: baseline IFN-γ for PFS, p = 0.000044; baseline IFN-γ for OS, p = 0.0000075; baseline IL4 for OS, p = 0.00099. Source data are provided as a Source Data file. Abbreviations: IFN-γ interferon-gamma, IL interleukin, PR, partial response, TNF tumor necrosis factor.

