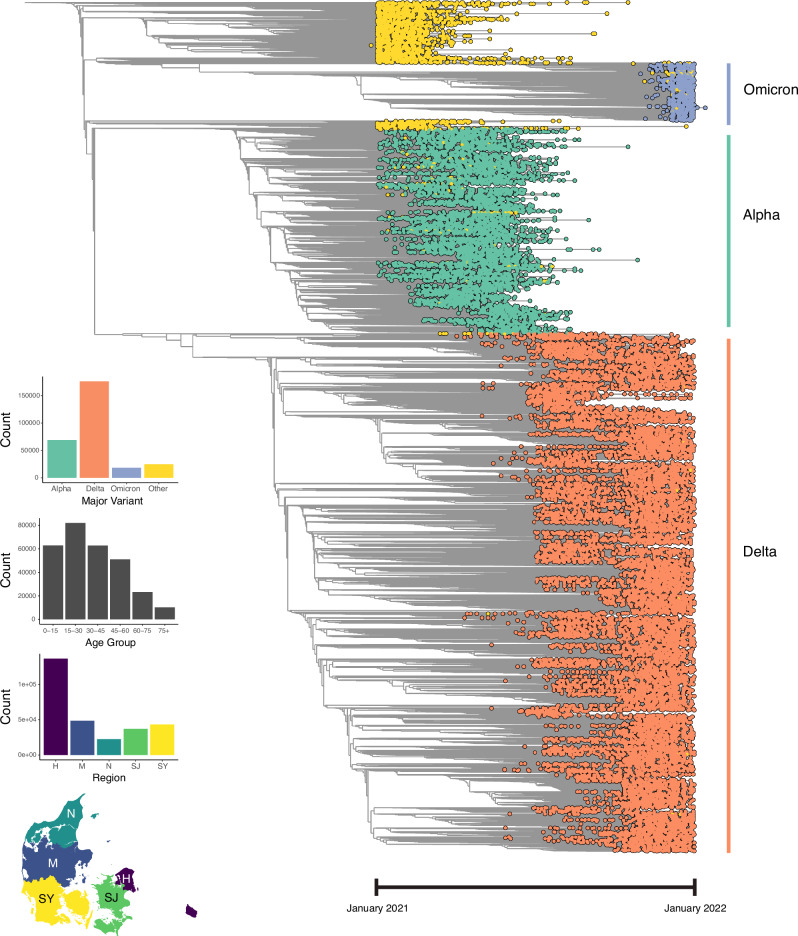
Fig. 3. Full-sample phylogenetic time tree (n = 291,791), visualised with Taxonium.
Tip colours represent major variant assignments using pangolin, with yellow tips representing 'others'. Bar plots depict tip distributions across major variants, age groups, and Danish regions. The map delineates the boundaries of Denmark’s five main regions: H (Hovedstaden), M (Midtjylland), N (Nordjylland), SJ (Sjælland) and SY (Syddanmark). In the first quarter of 2021, the population (in millions) in each region according to Statistics Denmark (https://statbank.dk) was: 1.86 (H), 1.33 (M), 0.59 (N), 0.84 (SJ), and 1.22 (SY).

