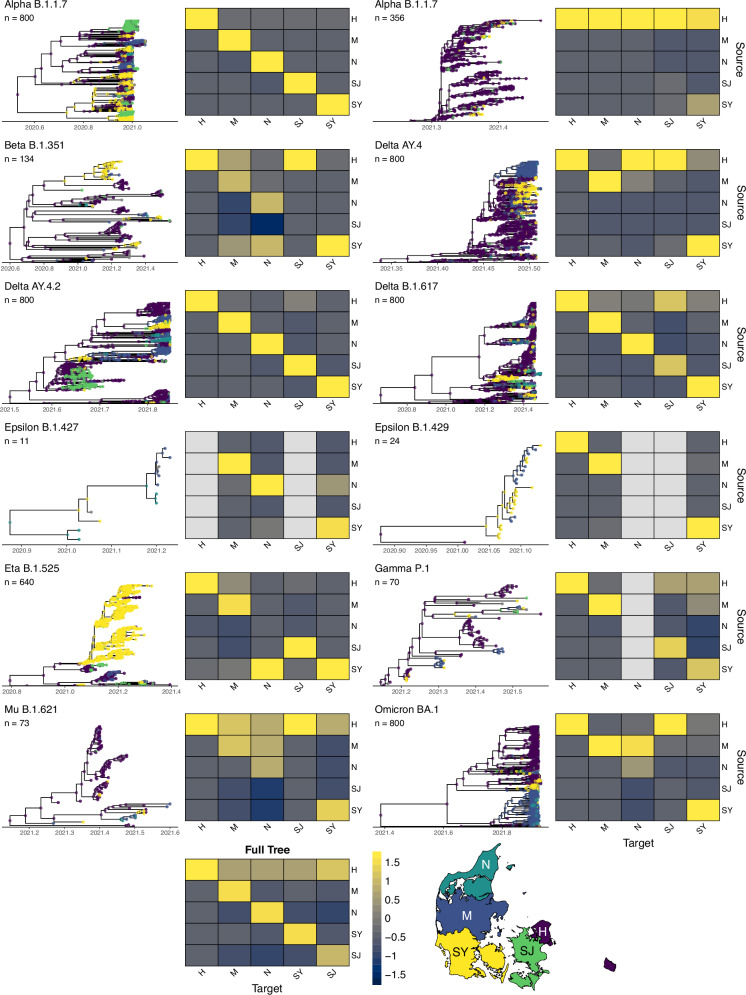
Fig. 4. Clades (n = 12) with tips and nodes coloured by region.
The selected clades are a subset of those shown in Table 1, with several unique clades of the same variant identified during the partitioning of the full tree. Nodes are coloured by their most likely value based on results from ancestral state reconstruction. Heat maps denote the number of directed transitions between regions, z-scored by column such that each column sum = 0. A transition is defined as a node from a given region (source) leading to a subsequent node or tip in the same or different region (target). Map outlines the boundaries of Denmark’s five main regions, with colours corresponding to nodes in the trees: H (Hovedstaden), M (Midtjylland), N (Nordjylland), SJ (Sjælland) and SY (Syddanmark).

